|
Download Data (XLS File) |
|
||||||||
|
||||||||
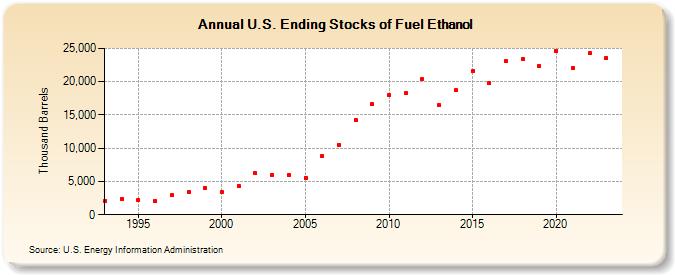
| U.S. Ending Stocks of Fuel Ethanol (Thousand Barrels) | ||||||||
| Decade | Year-0 | Year-1 | Year-2 | Year-3 | Year-4 | Year-5 | Year-6 | Year-7 | Year-8 | Year-9 |
|---|---|---|---|---|---|---|---|---|---|---|
| 1990's | 2,114 | 2,393 | 2,186 | 2,065 | 2,925 | 3,406 | 4,024 | |||
| 2000's | 3,400 | 4,298 | 6,200 | 5,978 | 6,002 | 5,563 | 8,760 | 10,535 | 14,226 | 16,594 |
| 2010's | 17,941 | 18,238 | 20,350 | 16,424 | 18,739 | 21,596 | 19,758 | 23,043 | 23,418 | 22,352 |
| 2020's | 24,663 | 22,036 | 24,245 | 23,589 |
| - = No Data Reported; -- = Not Applicable; NA = Not Available; W = Withheld to avoid disclosure of individual company data. |
| Release Date: 3/29/2024 |
| Next Release Date: 8/30/2024 |