|
Download Data (XLS File) |
|
||||||||
|
||||||||
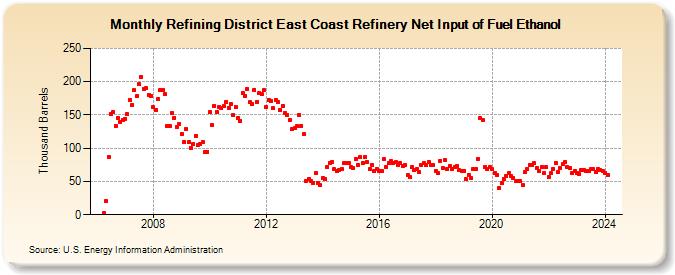
| Refining District East Coast Refinery Net Input of Fuel Ethanol (Thousand Barrels) | ||||||||
| Year | Jan | Feb | Mar | Apr | May | Jun | Jul | Aug | Sep | Oct | Nov | Dec |
|---|---|---|---|---|---|---|---|---|---|---|---|---|
| 2006 | 2 | 20 | 87 | 152 | 154 | 134 | 146 | 139 | 143 | |||
| 2007 | 144 | 151 | 173 | 165 | 187 | 178 | 196 | 207 | 189 | 190 | 180 | 179 |
| 2008 | 162 | 157 | 174 | 187 | 187 | 181 | 133 | 133 | 153 | 146 | 132 | 137 |
| 2009 | 122 | 109 | 129 | 109 | 101 | 106 | 119 | 105 | 107 | 109 | 94 | 95 |
| 2010 | 154 | 135 | 164 | 155 | 162 | 160 | 163 | 170 | 161 | 166 | 150 | 162 |
| 2011 | 146 | 141 | 183 | 179 | 189 | 169 | 166 | 188 | 170 | 183 | 181 | 187 |
| 2012 | 162 | 173 | 171 | 160 | 173 | 170 | 157 | 164 | 153 | 150 | 143 | 129 |
| 2013 | 130 | 133 | 150 | 133 | 121 | 51 | 54 | 50 | 48 | 62 | 48 | 44 |
| 2014 | 55 | 53 | 72 | 78 | 79 | 68 | 65 | 67 | 69 | 77 | 78 | 78 |
| 2015 | 71 | 70 | 84 | 75 | 86 | 78 | 87 | 79 | 68 | 75 | 65 | 69 |
| 2016 | 66 | 65 | 83 | 72 | 77 | 81 | 78 | 79 | 75 | 77 | 73 | 74 |
| 2017 | 59 | 57 | 71 | 67 | 69 | 64 | 75 | 78 | 75 | 79 | 74 | 74 |
| 2018 | 66 | 62 | 81 | 70 | 82 | 69 | 73 | 69 | 71 | 73 | 67 | 66 |
| 2019 | 66 | 53 | 60 | 55 | 69 | 68 | 84 | 145 | 142 | 72 | 69 | 72 |
| 2020 | 68 | 63 | 60 | 40 | 47 | 54 | 58 | 62 | 58 | 55 | 51 | 51 |
| 2021 | 50 | 45 | 64 | 69 | 75 | 74 | 77 | 70 | 66 | 72 | 62 | 71 |
| 2022 | 57 | 62 | 69 | 77 | 64 | 70 | 76 | 79 | 72 | 70 | 62 | 66 |
| 2023 | 62 | 61 | 67 | 67 | 65 | 65 | 68 | 68 | 64 | 69 | 67 | 66 |
| 2024 | 63 | |||||||||||
| - = No Data Reported; -- = Not Applicable; NA = Not Available; W = Withheld to avoid disclosure of individual company data. |
| Release Date: 3/29/2024 |
| Next Release Date: 4/30/2024 |
Referring Pages: