|
Download Data (XLS File) |
|
||||||||
|
||||||||
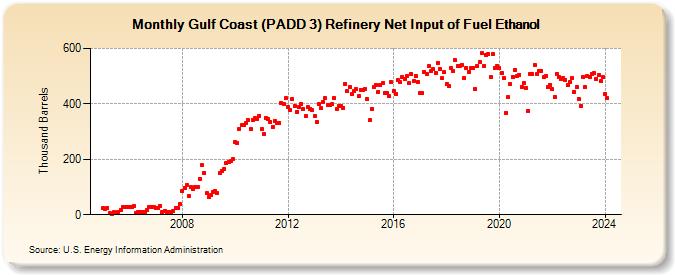
| Gulf Coast (PADD 3) Refinery Net Input of Fuel Ethanol (Thousand Barrels) | ||||||||
| Year | Jan | Feb | Mar | Apr | May | Jun | Jul | Aug | Sep | Oct | Nov | Dec |
|---|---|---|---|---|---|---|---|---|---|---|---|---|
| 2005 | 24 | 21 | 25 | 5 | 3 | 8 | 6 | 8 | 18 | 29 | 27 | 29 |
| 2006 | 29 | 29 | 31 | 5 | 8 | 9 | 9 | 9 | 16 | 27 | 28 | 28 |
| 2007 | 24 | 26 | 33 | 11 | 12 | 11 | 9 | 8 | 14 | 24 | 26 | 37 |
| 2008 | 84 | 98 | 108 | 67 | 99 | 94 | 100 | 100 | 129 | 178 | 152 | 77 |
| 2009 | 64 | 70 | 82 | 86 | 78 | 149 | 159 | 166 | 187 | 191 | 192 | 200 |
| 2010 | 263 | 258 | 311 | 322 | 324 | 332 | 340 | 308 | 343 | 348 | 345 | 356 |
| 2011 | 309 | 292 | 350 | 346 | 335 | 316 | 338 | 331 | 331 | 403 | 399 | 420 |
| 2012 | 388 | 376 | 418 | 392 | 372 | 390 | 401 | 383 | 355 | 387 | 383 | 376 |
| 2013 | 356 | 334 | 399 | 384 | 407 | 420 | 396 | 395 | 399 | 420 | 382 | 391 |
| 2014 | 392 | 386 | 473 | 445 | 461 | 436 | 446 | 453 | 427 | 451 | 450 | 453 |
| 2015 | 416 | 340 | 383 | 461 | 469 | 443 | 467 | 474 | 440 | 439 | 427 | 477 |
| 2016 | 447 | 435 | 485 | 477 | 495 | 488 | 501 | 475 | 508 | 481 | 500 | 480 |
| 2017 | 439 | 439 | 516 | 508 | 536 | 519 | 525 | 513 | 549 | 526 | 492 | 514 |
| 2018 | 472 | 465 | 530 | 517 | 557 | 536 | 538 | 541 | 492 | 530 | 516 | 530 |
| 2019 | 529 | 454 | 536 | 550 | 582 | 538 | 576 | 579 | 497 | 578 | 529 | 537 |
| 2020 | 529 | 511 | 492 | 368 | 423 | 470 | 496 | 522 | 501 | 505 | 461 | 475 |
| 2021 | 458 | 375 | 508 | 508 | 541 | 506 | 517 | 520 | 495 | 500 | 461 | 469 |
| 2022 | 453 | 426 | 509 | 497 | 490 | 494 | 486 | 468 | 480 | 492 | 444 | 461 |
| 2023 | 419 | 393 | 496 | 459 | 500 | 498 | 506 | 510 | 490 | 503 | 482 | 495 |
| 2024 | 437 | |||||||||||
| - = No Data Reported; -- = Not Applicable; NA = Not Available; W = Withheld to avoid disclosure of individual company data. |
| Release Date: 3/29/2024 |
| Next Release Date: 4/30/2024 |
Referring Pages: