|
Download Data (XLS File) |
|
||||||||
|
||||||||
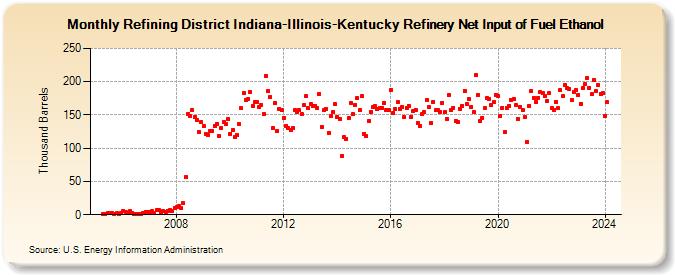
| Refining District Indiana-Illinois-Kentucky Refinery Net Input of Fuel Ethanol (Thousand Barrels) | ||||||||
| Year | Jan | Feb | Mar | Apr | May | Jun | Jul | Aug | Sep | Oct | Nov | Dec |
|---|---|---|---|---|---|---|---|---|---|---|---|---|
| 2005 | 1 | 1 | 2 | 2 | 2 | 1 | 2 | 1 | 2 | |||
| 2006 | 6 | 4 | 2 | 5 | 3 | 1 | 1 | 1 | 1 | 3 | 4 | 4 |
| 2007 | 4 | 5 | 3 | 7 | 7 | 3 | 5 | 4 | 6 | 7 | 5 | 10 |
| 2008 | 11 | 13 | 10 | 17 | 57 | 152 | 148 | 157 | 147 | 142 | 125 | 139 |
| 2009 | 133 | 121 | 120 | 126 | 126 | 134 | 137 | 119 | 130 | 139 | 136 | 144 |
| 2010 | 122 | 127 | 117 | 120 | 136 | 160 | 183 | 173 | 174 | 185 | 164 | 169 |
| 2011 | 169 | 162 | 165 | 151 | 209 | 186 | 177 | 130 | 168 | 126 | 159 | 157 |
| 2012 | 146 | 134 | 131 | 128 | 131 | 157 | 155 | 157 | 151 | 165 | 178 | 160 |
| 2013 | 167 | 164 | 164 | 160 | 182 | 132 | 157 | 159 | 123 | 148 | 154 | 166 |
| 2014 | 147 | 144 | 89 | 117 | 114 | 145 | 168 | 151 | 165 | 175 | 157 | 178 |
| 2015 | 122 | 118 | 141 | 155 | 162 | 163 | 159 | 161 | 161 | 168 | 158 | 158 |
| 2016 | 188 | 153 | 159 | 169 | 159 | 162 | 147 | 161 | 164 | 147 | 156 | 158 |
| 2017 | 138 | 134 | 151 | 154 | 173 | 162 | 138 | 170 | 157 | 157 | 154 | 168 |
| 2018 | 154 | 144 | 180 | 157 | 161 | 141 | 140 | 159 | 164 | 186 | 166 | 174 |
| 2019 | 162 | 154 | 210 | 180 | 141 | 146 | 160 | 175 | 174 | 165 | 169 | 180 |
| 2020 | 178 | 149 | 161 | 124 | 161 | 164 | 173 | 174 | 165 | 144 | 162 | 158 |
| 2021 | 147 | 110 | 164 | 186 | 176 | 170 | 176 | 184 | 183 | 178 | 171 | 183 |
| 2022 | 160 | 158 | 170 | 160 | 187 | 178 | 195 | 190 | 189 | 172 | 185 | 187 |
| 2023 | 180 | 167 | 190 | 196 | 205 | 191 | 181 | 203 | 186 | 195 | 182 | 183 |
| 2024 | 149 | 169 | 187 | 196 | 202 | 198 | ||||||
| - = No Data Reported; -- = Not Applicable; NA = Not Available; W = Withheld to avoid disclosure of individual company data. |
| Release Date: 8/30/2024 |
| Next Release Date: 9/30/2024 |