|
Download Data (XLS File) |
|
||||||||
|
||||||||
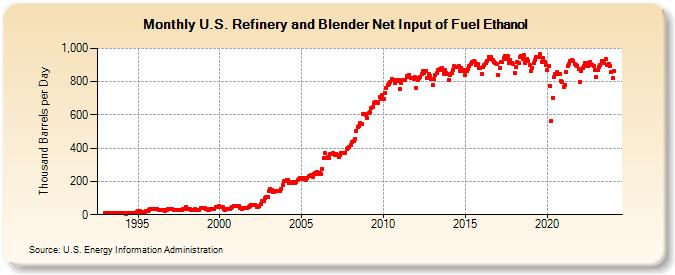
| U.S. Refinery and Blender Net Input of Fuel Ethanol (Thousand Barrels per Day) | ||||||||
| Year | Jan | Feb | Mar | Apr | May | Jun | Jul | Aug | Sep | Oct | Nov | Dec |
|---|---|---|---|---|---|---|---|---|---|---|---|---|
| 1993 | 9 | 10 | 10 | 9 | 9 | 8 | 9 | 8 | 9 | 8 | 13 | 11 |
| 1994 | 10 | 10 | 10 | 7 | 9 | 8 | 9 | 9 | 9 | 9 | 11 | 18 |
| 1995 | 22 | 22 | 19 | 19 | 18 | 18 | 23 | 23 | 26 | 34 | 37 | 37 |
| 1996 | 36 | 35 | 32 | 30 | 29 | 28 | 30 | 29 | 24 | 29 | 33 | 33 |
| 1997 | 32 | 33 | 31 | 30 | 29 | 29 | 29 | 29 | 31 | 35 | 34 | 45 |
| 1998 | 34 | 34 | 32 | 28 | 29 | 29 | 32 | 28 | 29 | 31 | 38 | 41 |
| 1999 | 40 | 38 | 35 | 30 | 31 | 32 | 33 | 33 | 35 | 44 | 49 | 53 |
| 2000 | 47 | 48 | 47 | 35 | 31 | 32 | 33 | 37 | 39 | 48 | 52 | 51 |
| 2001 | 54 | 55 | 55 | 41 | 37 | 38 | 38 | 39 | 38 | 49 | 55 | 58 |
| 2002 | 60 | 58 | 58 | 46 | 47 | 51 | 66 | 84 | 80 | 100 | 106 | 108 |
| 2003 | 143 | 156 | 148 | 137 | 138 | 142 | 143 | 144 | 142 | 155 | 180 | 201 |
| 2004 | 203 | 209 | 209 | 193 | 191 | 195 | 195 | 193 | 197 | 208 | 215 | 222 |
| 2005 | 214 | 221 | 222 | 211 | 218 | 231 | 232 | 236 | 225 | 243 | 252 | 258 |
| 2006 | 242 | 248 | 244 | 277 | 340 | 371 | 343 | 344 | 339 | 366 | 364 | 370 |
| 2007 | 357 | 368 | 359 | 348 | 359 | 373 | 370 | 373 | 374 | 397 | 403 | 408 |
| 2008 | 418 | 440 | 441 | 457 | 502 | 527 | 534 | 552 | 546 | 605 | 607 | 600 |
| 2009 | 583 | 611 | 617 | 642 | 645 | 672 | 676 | 676 | 673 | 705 | 697 | 720 |
| 2010 | 698 | 734 | 760 | 781 | 787 | 797 | 814 | 810 | 794 | 809 | 801 | 811 |
| 2011 | 758 | 792 | 807 | 812 | 811 | 837 | 828 | 843 | 820 | 820 | 817 | 826 |
| 2012 | 763 | 810 | 822 | 829 | 846 | 864 | 850 | 866 | 824 | 847 | 833 | 818 |
| 2013 | 781 | 817 | 843 | 851 | 870 | 874 | 869 | 885 | 848 | 870 | 855 | 845 |
| 2014 | 808 | 838 | 855 | 873 | 893 | 888 | 890 | 893 | 867 | 883 | 865 | 872 |
| 2015 | 839 | 864 | 875 | 894 | 904 | 919 | 923 | 919 | 901 | 908 | 880 | 883 |
| 2016 | 848 | 889 | 898 | 913 | 925 | 949 | 939 | 949 | 929 | 921 | 910 | 905 |
| 2017 | 843 | 882 | 919 | 917 | 942 | 957 | 935 | 955 | 915 | 928 | 914 | 906 |
| 2018 | 854 | 890 | 919 | 915 | 949 | 953 | 937 | 959 | 913 | 937 | 925 | 900 |
| 2019 | 867 | 883 | 914 | 930 | 947 | 946 | 951 | 967 | 920 | 940 | 920 | 898 |
| 2020 | 869 | 895 | 776 | 562 | 704 | 825 | 848 | 857 | 845 | 849 | 805 | 797 |
| 2021 | 769 | 780 | 859 | 893 | 909 | 927 | 928 | 925 | 907 | 903 | 896 | 875 |
| 2022 | 798 | 865 | 883 | 894 | 911 | 913 | 894 | 918 | 904 | 901 | 893 | 870 |
| 2023 | 827 | 870 | 891 | 900 | 925 | 925 | 911 | 934 | 899 | 908 | 894 | 859 |
| 2024 | 819 | |||||||||||
| - = No Data Reported; -- = Not Applicable; NA = Not Available; W = Withheld to avoid disclosure of individual company data. |
| Release Date: 3/29/2024 |
| Next Release Date: 4/30/2024 |