|
Download Data (XLS File) |
|
||||||||
|
||||||||
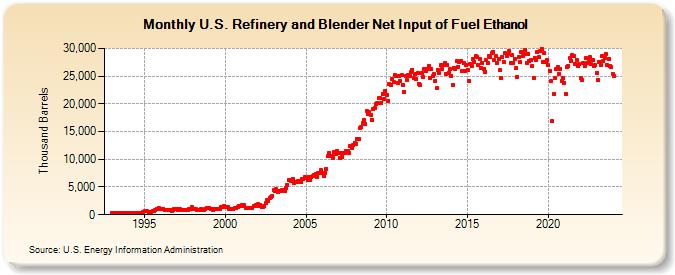
| U.S. Refinery and Blender Net Input of Fuel Ethanol (Thousand Barrels) | ||||||||
| Year | Jan | Feb | Mar | Apr | May | Jun | Jul | Aug | Sep | Oct | Nov | Dec |
|---|---|---|---|---|---|---|---|---|---|---|---|---|
| 1993 | 284 | 270 | 296 | 258 | 267 | 242 | 266 | 244 | 271 | 241 | 386 | 326 |
| 1994 | 305 | 284 | 301 | 220 | 274 | 246 | 275 | 292 | 258 | 285 | 333 | 547 |
| 1995 | 668 | 624 | 592 | 578 | 552 | 544 | 711 | 709 | 773 | 1,052 | 1,104 | 1,148 |
| 1996 | 1,120 | 1,017 | 994 | 887 | 898 | 832 | 916 | 886 | 713 | 898 | 986 | 1,009 |
| 1997 | 1,001 | 932 | 973 | 907 | 894 | 860 | 890 | 907 | 921 | 1,082 | 1,030 | 1,406 |
| 1998 | 1,041 | 965 | 983 | 840 | 903 | 880 | 995 | 867 | 876 | 952 | 1,151 | 1,269 |
| 1999 | 1,231 | 1,058 | 1,078 | 899 | 946 | 963 | 1,016 | 1,027 | 1,048 | 1,361 | 1,457 | 1,651 |
| 2000 | 1,449 | 1,398 | 1,457 | 1,050 | 970 | 966 | 1,010 | 1,158 | 1,181 | 1,481 | 1,558 | 1,590 |
| 2001 | 1,689 | 1,548 | 1,694 | 1,216 | 1,162 | 1,128 | 1,173 | 1,220 | 1,144 | 1,512 | 1,657 | 1,786 |
| 2002 | 1,857 | 1,621 | 1,799 | 1,380 | 1,447 | 1,535 | 2,049 | 2,594 | 2,409 | 3,102 | 3,188 | 3,339 |
| 2003 | 4,426 | 4,361 | 4,574 | 4,119 | 4,290 | 4,266 | 4,421 | 4,454 | 4,269 | 4,795 | 5,411 | 6,240 |
| 2004 | 6,278 | 6,067 | 6,469 | 5,781 | 5,936 | 5,860 | 6,035 | 5,997 | 5,895 | 6,457 | 6,447 | 6,873 |
| 2005 | 6,631 | 6,196 | 6,882 | 6,318 | 6,748 | 6,917 | 7,199 | 7,331 | 6,763 | 7,546 | 7,548 | 8,009 |
| 2006 | 7,493 | 6,953 | 7,567 | 8,302 | 10,530 | 11,142 | 10,629 | 10,668 | 10,181 | 11,335 | 10,913 | 11,485 |
| 2007 | 11,081 | 10,308 | 11,140 | 10,437 | 11,143 | 11,186 | 11,480 | 11,560 | 11,216 | 12,317 | 12,088 | 12,647 |
| 2008 | 12,956 | 12,750 | 13,679 | 13,716 | 15,557 | 15,819 | 16,548 | 17,098 | 16,387 | 18,769 | 18,212 | 18,593 |
| 2009 | 18,073 | 17,105 | 19,137 | 19,252 | 20,008 | 20,159 | 20,962 | 20,967 | 20,195 | 21,862 | 20,923 | 22,312 |
| 2010 | 21,631 | 20,565 | 23,574 | 23,429 | 24,401 | 23,922 | 25,224 | 25,095 | 23,809 | 25,065 | 24,040 | 25,128 |
| 2011 | 23,485 | 22,173 | 25,032 | 24,363 | 25,145 | 25,109 | 25,678 | 26,148 | 24,602 | 25,421 | 24,514 | 25,596 |
| 2012 | 23,654 | 23,479 | 25,491 | 24,858 | 26,227 | 25,907 | 26,344 | 26,859 | 24,722 | 26,269 | 24,975 | 25,370 |
| 2013 | 24,208 | 22,867 | 26,139 | 25,520 | 26,971 | 26,209 | 26,946 | 27,449 | 25,443 | 26,970 | 25,651 | 26,195 |
| 2014 | 25,059 | 23,454 | 26,510 | 26,196 | 27,696 | 26,646 | 27,589 | 27,681 | 25,999 | 27,379 | 25,935 | 27,027 |
| 2015 | 26,023 | 24,202 | 27,118 | 26,818 | 28,035 | 27,574 | 28,601 | 28,502 | 27,038 | 28,156 | 26,408 | 27,383 |
| 2016 | 26,276 | 25,791 | 27,852 | 27,397 | 28,670 | 28,455 | 29,119 | 29,416 | 27,867 | 28,554 | 27,313 | 28,057 |
| 2017 | 26,120 | 24,700 | 28,483 | 27,511 | 29,206 | 28,700 | 28,985 | 29,596 | 27,450 | 28,756 | 27,427 | 28,089 |
| 2018 | 26,462 | 24,909 | 28,486 | 27,464 | 29,423 | 28,593 | 29,053 | 29,718 | 27,395 | 29,057 | 27,754 | 27,891 |
| 2019 | 26,876 | 24,713 | 28,348 | 27,901 | 29,357 | 28,369 | 29,480 | 29,966 | 27,602 | 29,142 | 27,587 | 27,827 |
| 2020 | 26,937 | 25,963 | 24,058 | 16,847 | 21,813 | 24,736 | 26,279 | 26,565 | 25,354 | 26,318 | 24,136 | 24,700 |
| 2021 | 23,844 | 21,850 | 26,621 | 26,791 | 28,193 | 27,802 | 28,767 | 28,679 | 27,206 | 27,987 | 26,885 | 27,122 |
| 2022 | 24,730 | 24,221 | 27,375 | 26,808 | 28,256 | 27,384 | 27,712 | 28,443 | 27,120 | 27,916 | 26,775 | 26,982 |
| 2023 | 25,624 | 24,372 | 27,622 | 27,010 | 28,690 | 27,758 | 28,226 | 28,957 | 26,981 | 28,153 | 26,825 | 26,644 |
| 2024 | 25,382 | |||||||||||
| - = No Data Reported; -- = Not Applicable; NA = Not Available; W = Withheld to avoid disclosure of individual company data. |
| Release Date: 3/29/2024 |
| Next Release Date: 4/30/2024 |