|
Download Data (XLS File) |
|
||||||||
|
||||||||
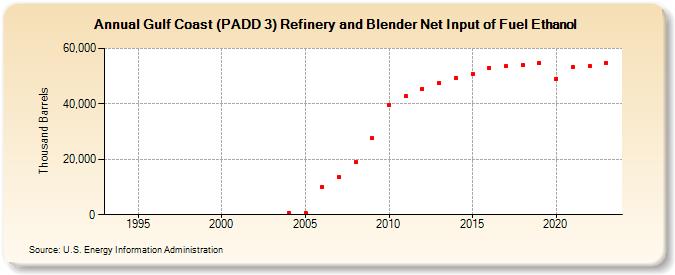
| Gulf Coast (PADD 3) Refinery and Blender Net Input of Fuel Ethanol (Thousand Barrels) | ||||||||
| Decade | Year-0 | Year-1 | Year-2 | Year-3 | Year-4 | Year-5 | Year-6 | Year-7 | Year-8 | Year-9 |
|---|---|---|---|---|---|---|---|---|---|---|
| 1990's | W | W | W | W | W | W | W | |||
| 2000's | W | W | W | W | 576 | 748 | 10,121 | 13,584 | 18,912 | 27,522 |
| 2010's | 39,528 | 42,688 | 45,530 | 47,522 | 49,407 | 50,812 | 53,057 | 53,554 | 54,070 | 54,786 |
| 2020's | 49,138 | 53,333 | 53,697 | 54,743 |
| - = No Data Reported; -- = Not Applicable; NA = Not Available; W = Withheld to avoid disclosure of individual company data. |
| Release Date: 3/29/2024 |
| Next Release Date: 8/30/2024 |