|
Download Data (XLS File) |
|
||||||||
|
||||||||
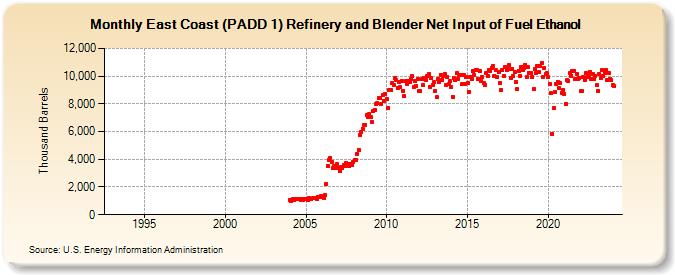
| East Coast (PADD 1) Refinery and Blender Net Input of Fuel Ethanol (Thousand Barrels) | ||||||||
| Year | Jan | Feb | Mar | Apr | May | Jun | Jul | Aug | Sep | Oct | Nov | Dec |
|---|---|---|---|---|---|---|---|---|---|---|---|---|
| 1993 | W | W | W | W | W | W | W | W | W | W | W | W |
| 1994 | W | W | W | W | W | W | W | W | W | W | W | W |
| 1995 | W | W | W | W | W | W | W | W | W | W | W | W |
| 1996 | W | W | W | W | W | W | W | W | W | W | W | W |
| 1997 | W | W | W | W | W | W | W | W | W | W | W | W |
| 1998 | W | W | W | W | W | W | W | W | W | W | W | W |
| 1999 | W | W | W | W | W | W | W | W | W | W | W | W |
| 2000 | W | W | W | W | W | W | W | W | W | W | W | W |
| 2001 | W | W | W | W | W | W | W | W | W | W | W | W |
| 2002 | W | W | W | W | W | W | W | W | W | W | W | W |
| 2003 | W | W | W | W | W | W | W | W | W | W | W | W |
| 2004 | 1,046 | 972 | 1,111 | 1,070 | 1,138 | 1,112 | 1,126 | 1,117 | 1,086 | 1,124 | 1,074 | 1,159 |
| 2005 | 1,119 | 1,038 | 1,192 | 1,142 | 1,143 | 1,191 | 1,210 | 1,211 | 1,163 | 1,247 | 1,260 | 1,349 |
| 2006 | 1,295 | 1,202 | 1,398 | 2,235 | 3,542 | 3,962 | 4,109 | 3,814 | 3,364 | 3,508 | 3,338 | 3,660 |
| 2007 | 3,386 | 3,156 | 3,431 | 3,350 | 3,601 | 3,549 | 3,734 | 3,637 | 3,540 | 3,664 | 3,565 | 3,820 |
| 2008 | 3,942 | 3,966 | 4,403 | 4,654 | 5,747 | 5,998 | 6,205 | 6,478 | 6,466 | 7,200 | 7,069 | 7,260 |
| 2009 | 7,038 | 6,693 | 7,449 | 7,583 | 8,000 | 8,040 | 8,405 | 8,409 | 8,021 | 8,638 | 8,232 | 8,721 |
| 2010 | 8,350 | 7,707 | 9,014 | 8,983 | 9,523 | 9,345 | 9,834 | 9,688 | 9,159 | 9,603 | 9,200 | 9,660 |
| 2011 | 8,932 | 8,571 | 9,650 | 9,407 | 9,668 | 9,554 | 9,809 | 9,991 | 9,246 | 9,632 | 9,282 | 9,794 |
| 2012 | 8,904 | 8,891 | 9,756 | 9,356 | 9,845 | 9,724 | 10,006 | 10,136 | 9,237 | 9,831 | 9,383 | 9,559 |
| 2013 | 8,923 | 8,485 | 9,814 | 9,597 | 10,110 | 9,747 | 10,020 | 10,142 | 9,373 | 9,952 | 9,410 | 9,624 |
| 2014 | 9,203 | 8,522 | 9,841 | 9,704 | 10,203 | 9,803 | 10,055 | 10,104 | 9,447 | 10,052 | 9,464 | 9,932 |
| 2015 | 9,530 | 8,871 | 9,958 | 9,803 | 10,376 | 10,090 | 10,447 | 10,453 | 9,809 | 10,337 | 9,666 | 9,962 |
| 2016 | 9,497 | 9,354 | 10,211 | 10,006 | 10,442 | 10,390 | 10,605 | 10,742 | 10,020 | 10,418 | 9,965 | 10,276 |
| 2017 | 9,532 | 9,029 | 10,414 | 10,019 | 10,623 | 10,421 | 10,520 | 10,770 | 9,898 | 10,510 | 10,036 | 10,267 |
| 2018 | 9,610 | 9,048 | 10,395 | 10,015 | 10,666 | 10,425 | 10,570 | 10,831 | 9,949 | 10,622 | 10,189 | 10,231 |
| 2019 | 9,915 | 9,082 | 10,510 | 10,210 | 10,764 | 10,328 | 10,728 | 10,954 | 9,954 | 10,571 | 10,137 | 10,198 |
| 2020 | 9,918 | 9,461 | 8,775 | 5,847 | 7,675 | 8,825 | 9,439 | 9,595 | 9,138 | 9,515 | 8,802 | 8,980 |
| 2021 | 8,693 | 8,007 | 9,691 | 9,670 | 10,222 | 10,031 | 10,374 | 10,353 | 9,788 | 10,185 | 9,759 | 9,855 |
| 2022 | 8,891 | 8,904 | 9,931 | 9,690 | 10,218 | 9,903 | 10,022 | 10,329 | 9,783 | 10,118 | 9,811 | 9,977 |
| 2023 | 9,376 | 8,937 | 10,154 | 9,849 | 10,417 | 9,986 | 10,248 | 10,465 | 9,715 | 10,238 | 9,813 | 9,692 |
| 2024 | 9,370 | |||||||||||
| - = No Data Reported; -- = Not Applicable; NA = Not Available; W = Withheld to avoid disclosure of individual company data. |
| Release Date: 3/29/2024 |
| Next Release Date: 4/30/2024 |