|
Download Data (XLS File) |
|
||||||||
|
||||||||
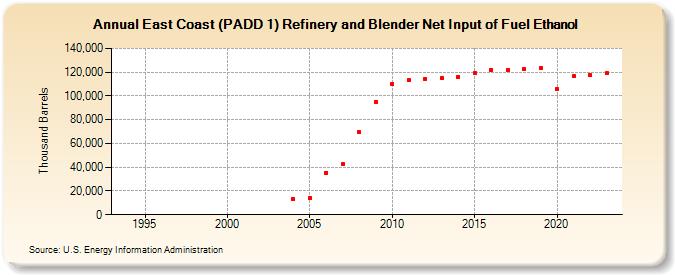
| East Coast (PADD 1) Refinery and Blender Net Input of Fuel Ethanol (Thousand Barrels) | ||||||||
| Decade | Year-0 | Year-1 | Year-2 | Year-3 | Year-4 | Year-5 | Year-6 | Year-7 | Year-8 | Year-9 |
|---|---|---|---|---|---|---|---|---|---|---|
| 1990's | W | W | W | W | W | W | W | |||
| 2000's | W | W | W | W | 13,135 | 14,265 | 35,427 | 42,433 | 69,388 | 95,229 |
| 2010's | 110,066 | 113,536 | 114,628 | 115,197 | 116,330 | 119,302 | 121,926 | 122,039 | 122,551 | 123,351 |
| 2020's | 105,970 | 116,628 | 117,577 | 118,890 |
| - = No Data Reported; -- = Not Applicable; NA = Not Available; W = Withheld to avoid disclosure of individual company data. |
| Release Date: 3/29/2024 |
| Next Release Date: 8/30/2024 |