|
Download Data (XLS File) |
|
||||||||
|
||||||||
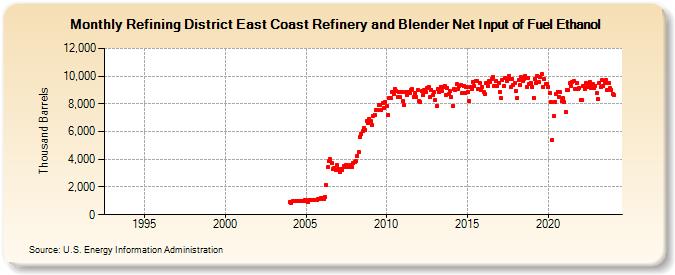
| Refining District East Coast Refinery and Blender Net Input of Fuel Ethanol (Thousand Barrels) | ||||||||
| Year | Jan | Feb | Mar | Apr | May | Jun | Jul | Aug | Sep | Oct | Nov | Dec |
|---|---|---|---|---|---|---|---|---|---|---|---|---|
| 1993 | W | W | W | W | W | W | W | W | W | W | W | W |
| 1994 | W | W | W | W | W | W | W | W | W | W | W | W |
| 1995 | W | W | W | W | W | W | W | W | W | W | W | W |
| 1996 | W | W | W | W | W | W | W | W | W | W | W | W |
| 1997 | W | W | W | W | W | W | W | W | W | W | W | W |
| 1998 | W | W | W | W | W | W | W | W | W | W | W | W |
| 1999 | W | W | W | W | W | W | W | W | W | W | W | W |
| 2000 | W | W | W | W | W | W | W | W | W | W | W | W |
| 2001 | W | W | W | W | W | W | W | W | W | W | W | W |
| 2002 | W | W | W | W | W | W | W | W | W | W | W | W |
| 2003 | W | W | W | W | W | W | W | W | W | W | W | W |
| 2004 | 939 | 871 | 1,001 | 955 | 1,018 | 1,001 | 1,006 | 996 | 975 | 1,010 | 966 | 1,045 |
| 2005 | 1,018 | 941 | 1,082 | 1,039 | 1,031 | 1,078 | 1,093 | 1,090 | 1,066 | 1,144 | 1,157 | 1,241 |
| 2006 | 1,203 | 1,111 | 1,292 | 2,135 | 3,437 | 3,855 | 3,991 | 3,701 | 3,263 | 3,400 | 3,233 | 3,552 |
| 2007 | 3,292 | 3,058 | 3,329 | 3,248 | 3,486 | 3,439 | 3,622 | 3,520 | 3,433 | 3,554 | 3,461 | 3,710 |
| 2008 | 3,836 | 3,854 | 4,265 | 4,516 | 5,585 | 5,828 | 6,012 | 6,285 | 6,114 | 6,775 | 6,651 | 6,918 |
| 2009 | 6,757 | 6,469 | 7,138 | 7,195 | 7,556 | 7,587 | 7,933 | 7,942 | 7,540 | 8,050 | 7,709 | 8,133 |
| 2010 | 7,822 | 7,218 | 8,430 | 8,391 | 8,875 | 8,681 | 9,091 | 8,951 | 8,461 | 8,856 | 8,465 | 8,889 |
| 2011 | 8,222 | 7,913 | 8,873 | 8,633 | 8,858 | 8,785 | 9,010 | 9,083 | 8,513 | 8,812 | 8,483 | 8,993 |
| 2012 | 8,192 | 8,153 | 8,940 | 8,613 | 8,984 | 8,874 | 9,148 | 9,247 | 8,463 | 9,031 | 8,614 | 8,827 |
| 2013 | 8,247 | 7,818 | 9,041 | 8,831 | 9,238 | 8,955 | 9,188 | 9,309 | 8,620 | 9,151 | 8,679 | 8,897 |
| 2014 | 8,489 | 7,859 | 9,077 | 8,966 | 9,399 | 9,041 | 9,299 | 9,324 | 8,746 | 9,277 | 8,762 | 9,203 |
| 2015 | 8,841 | 8,191 | 9,236 | 9,099 | 9,585 | 9,308 | 9,649 | 9,656 | 9,057 | 9,532 | 8,971 | 9,225 |
| 2016 | 8,832 | 8,693 | 9,488 | 9,285 | 9,653 | 9,602 | 9,817 | 9,937 | 9,283 | 9,681 | 9,252 | 9,537 |
| 2017 | 8,877 | 8,405 | 9,687 | 9,296 | 9,862 | 9,674 | 9,789 | 10,011 | 9,192 | 9,760 | 9,328 | 9,530 |
| 2018 | 8,947 | 8,450 | 9,707 | 9,361 | 9,900 | 9,678 | 9,788 | 10,036 | 9,238 | 9,850 | 9,452 | 9,509 |
| 2019 | 9,234 | 8,449 | 9,777 | 9,483 | 9,989 | 9,575 | 9,928 | 10,127 | 9,204 | 9,788 | 9,415 | 9,465 |
| 2020 | 9,217 | 8,792 | 8,155 | 5,414 | 7,087 | 8,141 | 8,714 | 8,872 | 8,488 | 8,819 | 8,190 | 8,385 |
| 2021 | 8,112 | 7,430 | 9,002 | 8,989 | 9,470 | 9,294 | 9,607 | 9,619 | 9,087 | 9,470 | 9,088 | 9,165 |
| 2022 | 8,272 | 8,298 | 9,275 | 9,059 | 9,508 | 9,195 | 9,325 | 9,610 | 9,115 | 9,409 | 9,149 | 9,318 |
| 2023 | 8,748 | 8,332 | 9,472 | 9,187 | 9,697 | 9,285 | 9,515 | 9,724 | 9,030 | 9,525 | 9,124 | 9,012 |
| 2024 | 8,733 | |||||||||||
| - = No Data Reported; -- = Not Applicable; NA = Not Available; W = Withheld to avoid disclosure of individual company data. |
| Release Date: 3/29/2024 |
| Next Release Date: 4/30/2024 |