|
Download Data (XLS File) |
|
||||||||
|
||||||||
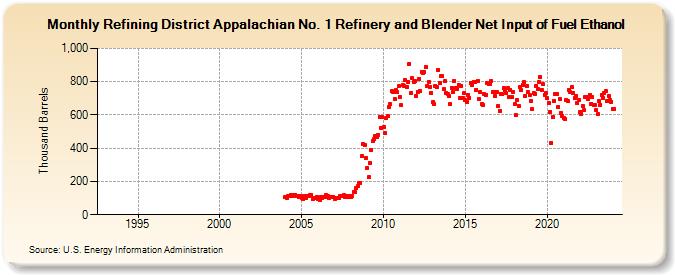
| Refining District Appalachian No. 1 Refinery and Blender Net Input of Fuel Ethanol (Thousand Barrels) | ||||||||
| Year | Jan | Feb | Mar | Apr | May | Jun | Jul | Aug | Sep | Oct | Nov | Dec |
|---|---|---|---|---|---|---|---|---|---|---|---|---|
| 1993 | W | W | W | W | W | W | W | W | W | W | W | W |
| 1994 | W | W | W | W | W | W | W | W | W | W | W | W |
| 1995 | W | W | W | W | W | W | W | W | W | W | W | W |
| 1996 | W | W | W | W | W | W | W | W | W | W | W | W |
| 1997 | W | W | W | W | W | W | W | W | W | W | W | W |
| 1998 | W | W | W | W | W | W | W | W | W | W | W | W |
| 1999 | W | W | W | W | W | W | W | W | W | W | W | W |
| 2000 | W | W | W | W | W | W | W | W | W | W | W | W |
| 2001 | W | W | W | W | W | W | W | W | W | W | W | W |
| 2002 | W | W | W | W | W | W | W | W | W | W | W | W |
| 2003 | W | W | W | W | W | W | W | W | W | W | W | W |
| 2004 | 107 | 101 | 110 | 115 | 120 | 111 | 120 | 121 | 111 | 114 | 108 | 114 |
| 2005 | 101 | 97 | 110 | 103 | 112 | 113 | 117 | 121 | 97 | 103 | 103 | 108 |
| 2006 | 92 | 91 | 106 | 100 | 105 | 107 | 118 | 113 | 101 | 108 | 105 | 108 |
| 2007 | 94 | 98 | 102 | 102 | 115 | 110 | 112 | 117 | 107 | 110 | 104 | 110 |
| 2008 | 106 | 112 | 138 | 138 | 162 | 170 | 193 | 193 | 352 | 425 | 418 | 342 |
| 2009 | 281 | 224 | 311 | 388 | 444 | 453 | 472 | 467 | 481 | 588 | 523 | 588 |
| 2010 | 528 | 489 | 584 | 592 | 648 | 664 | 743 | 737 | 698 | 747 | 735 | 771 |
| 2011 | 710 | 658 | 777 | 774 | 810 | 769 | 799 | 908 | 733 | 820 | 799 | 801 |
| 2012 | 712 | 738 | 816 | 743 | 861 | 850 | 858 | 889 | 774 | 800 | 769 | 732 |
| 2013 | 676 | 667 | 773 | 766 | 872 | 792 | 832 | 833 | 753 | 801 | 731 | 727 |
| 2014 | 714 | 663 | 764 | 738 | 804 | 762 | 756 | 780 | 701 | 775 | 702 | 729 |
| 2015 | 689 | 680 | 722 | 704 | 791 | 782 | 798 | 797 | 752 | 805 | 695 | 737 |
| 2016 | 665 | 661 | 723 | 721 | 789 | 788 | 788 | 805 | 737 | 737 | 713 | 739 |
| 2017 | 655 | 624 | 727 | 723 | 761 | 747 | 731 | 759 | 706 | 750 | 708 | 737 |
| 2018 | 663 | 598 | 688 | 654 | 766 | 747 | 782 | 795 | 711 | 772 | 737 | 722 |
| 2019 | 681 | 633 | 733 | 727 | 775 | 753 | 800 | 827 | 750 | 783 | 722 | 733 |
| 2020 | 701 | 669 | 620 | 433 | 588 | 684 | 725 | 723 | 650 | 696 | 612 | 595 |
| 2021 | 581 | 577 | 689 | 681 | 752 | 737 | 767 | 734 | 701 | 715 | 671 | 690 |
| 2022 | 619 | 606 | 656 | 631 | 710 | 708 | 697 | 719 | 668 | 709 | 662 | 659 |
| 2023 | 628 | 605 | 682 | 662 | 720 | 701 | 733 | 741 | 685 | 713 | 689 | 680 |
| 2024 | 637 | |||||||||||
| - = No Data Reported; -- = Not Applicable; NA = Not Available; W = Withheld to avoid disclosure of individual company data. |
| Release Date: 3/29/2024 |
| Next Release Date: 4/30/2024 |