|
Download Data (XLS File) |
|
||||||||
|
||||||||
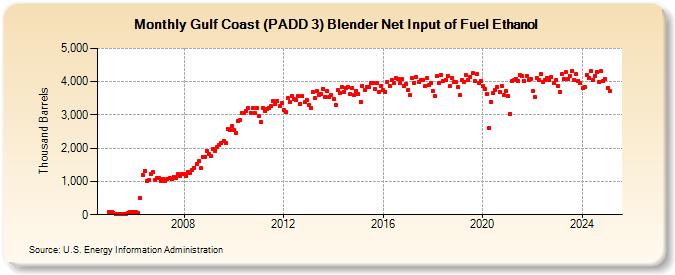
| Gulf Coast (PADD 3) Blender Net Input of Fuel Ethanol (Thousand Barrels) | ||||||||
| Year | Jan | Feb | Mar | Apr | May | Jun | Jul | Aug | Sep | Oct | Nov | Dec |
|---|---|---|---|---|---|---|---|---|---|---|---|---|
| 2005 | 77 | 75 | 44 | 16 | 20 | 20 | 14 | 21 | 33 | 66 | 82 | 77 |
| 2006 | 82 | 74 | 43 | 508 | 1,182 | 1,316 | 999 | 1,036 | 1,217 | 1,278 | 1,050 | 1,108 |
| 2007 | 1,103 | 1,026 | 1,087 | 1,023 | 1,078 | 1,117 | 1,067 | 1,143 | 1,106 | 1,211 | 1,171 | 1,217 |
| 2008 | 1,228 | 1,178 | 1,283 | 1,253 | 1,350 | 1,413 | 1,518 | 1,613 | 1,397 | 1,747 | 1,744 | 1,902 |
| 2009 | 1,814 | 1,768 | 1,971 | 1,930 | 2,026 | 2,107 | 2,147 | 2,211 | 2,146 | 2,577 | 2,548 | 2,653 |
| 2010 | 2,554 | 2,457 | 2,827 | 2,856 | 3,065 | 3,048 | 3,129 | 3,215 | 3,067 | 3,194 | 3,060 | 3,206 |
| 2011 | 2,967 | 2,794 | 3,220 | 3,119 | 3,186 | 3,218 | 3,254 | 3,406 | 3,319 | 3,423 | 3,262 | 3,350 |
| 2012 | 3,160 | 3,098 | 3,494 | 3,374 | 3,580 | 3,467 | 3,442 | 3,573 | 3,341 | 3,565 | 3,380 | 3,435 |
| 2013 | 3,287 | 3,214 | 3,690 | 3,514 | 3,713 | 3,607 | 3,642 | 3,792 | 3,553 | 3,712 | 3,531 | 3,584 |
| 2014 | 3,477 | 3,308 | 3,740 | 3,666 | 3,850 | 3,701 | 3,813 | 3,838 | 3,619 | 3,815 | 3,584 | 3,723 |
| 2015 | 3,626 | 3,399 | 3,880 | 3,741 | 3,854 | 3,827 | 3,971 | 3,970 | 3,788 | 3,945 | 3,693 | 3,882 |
| 2016 | 3,735 | 3,694 | 4,000 | 3,863 | 4,047 | 3,949 | 4,096 | 4,079 | 3,948 | 4,079 | 3,860 | 3,935 |
| 2017 | 3,761 | 3,591 | 4,111 | 3,968 | 4,135 | 3,987 | 4,062 | 4,046 | 3,856 | 4,097 | 3,904 | 3,960 |
| 2018 | 3,725 | 3,554 | 4,167 | 3,971 | 4,205 | 4,029 | 4,060 | 4,174 | 3,876 | 4,119 | 3,986 | 3,980 |
| 2019 | 3,825 | 3,589 | 4,049 | 4,004 | 4,199 | 4,039 | 4,151 | 4,247 | 4,011 | 4,217 | 3,957 | 4,013 |
| 2020 | 3,867 | 3,779 | 3,622 | 2,593 | 3,401 | 3,655 | 3,750 | 3,846 | 3,699 | 3,874 | 3,592 | 3,707 |
| 2021 | 3,564 | 3,042 | 4,021 | 4,042 | 4,093 | 4,031 | 4,187 | 4,156 | 4,017 | 4,179 | 4,059 | 4,084 |
| 2022 | 3,710 | 3,530 | 4,121 | 4,056 | 4,242 | 4,002 | 4,051 | 4,109 | 4,035 | 4,140 | 3,964 | 4,037 |
| 2023 | 3,857 | 3,688 | 4,242 | 4,073 | 4,273 | 4,117 | 4,182 | 4,304 | 4,083 | 4,227 | 3,993 | 3,953 |
| 2024 | 3,801 | |||||||||||
| - = No Data Reported; -- = Not Applicable; NA = Not Available; W = Withheld to avoid disclosure of individual company data. |
| Release Date: 3/29/2024 |
| Next Release Date: 4/30/2024 |
Referring Pages: