|
Download Data (XLS File) |
|
||||||||
|
||||||||
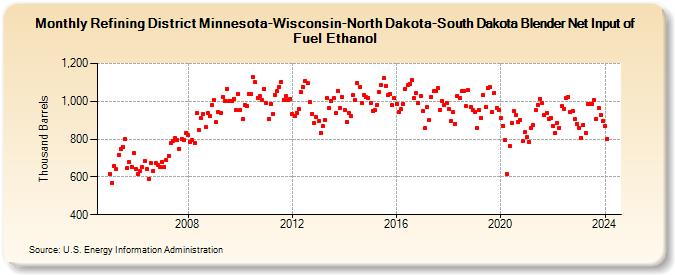
| Refining District Minnesota-Wisconsin-North Dakota-South Dakota Blender Net Input of Fuel Ethanol (Thousand Barrels) | ||||||||
| Year | Jan | Feb | Mar | Apr | May | Jun | Jul | Aug | Sep | Oct | Nov | Dec |
|---|---|---|---|---|---|---|---|---|---|---|---|---|
| 2005 | 616 | 567 | 657 | 640 | 717 | 746 | 760 | 801 | 647 | 677 | 655 | 724 |
| 2006 | 642 | 614 | 629 | 651 | 684 | 640 | 591 | 673 | 633 | 676 | 665 | 653 |
| 2007 | 679 | 651 | 687 | 713 | 779 | 790 | 807 | 797 | 750 | 801 | 795 | 833 |
| 2008 | 820 | 784 | 794 | 782 | 937 | 849 | 910 | 932 | 865 | 937 | 920 | 980 |
| 2009 | 1,006 | 888 | 942 | 940 | 1,024 | 1,004 | 1,067 | 999 | 1,004 | 1,013 | 952 | 1,040 |
| 2010 | 955 | 906 | 979 | 976 | 1,041 | 1,038 | 1,127 | 1,101 | 1,018 | 1,026 | 1,005 | 1,067 |
| 2011 | 991 | 907 | 986 | 934 | 1,035 | 1,053 | 1,077 | 1,104 | 1,007 | 1,026 | 1,007 | 1,014 |
| 2012 | 932 | 921 | 940 | 958 | 1,051 | 1,076 | 1,107 | 1,096 | 994 | 935 | 886 | 917 |
| 2013 | 897 | 834 | 869 | 902 | 1,017 | 964 | 1,004 | 1,015 | 938 | 1,057 | 964 | 1,021 |
| 2014 | 955 | 891 | 938 | 920 | 1,033 | 1,006 | 1,097 | 1,074 | 993 | 1,035 | 1,021 | 1,020 |
| 2015 | 993 | 949 | 952 | 981 | 1,050 | 1,084 | 1,123 | 1,083 | 1,034 | 1,041 | 978 | 1,017 |
| 2016 | 986 | 944 | 957 | 986 | 1,065 | 1,086 | 1,093 | 1,112 | 1,015 | 1,046 | 990 | 1,026 |
| 2017 | 947 | 857 | 969 | 902 | 1,023 | 1,052 | 1,055 | 1,068 | 956 | 1,000 | 980 | 992 |
| 2018 | 961 | 896 | 941 | 882 | 1,029 | 1,020 | 1,053 | 1,057 | 973 | 1,059 | 970 | 955 |
| 2019 | 941 | 861 | 956 | 911 | 1,033 | 972 | 1,068 | 1,075 | 943 | 1,046 | 967 | 954 |
| 2020 | 911 | 871 | 795 | 614 | 766 | 883 | 946 | 929 | 888 | 902 | 788 | 835 |
| 2021 | 810 | 783 | 858 | 874 | 954 | 981 | 1,014 | 989 | 927 | 938 | 908 | 912 |
| 2022 | 868 | 831 | 887 | 861 | 975 | 960 | 1,020 | 1,025 | 941 | 949 | 904 | 882 |
| 2023 | 858 | 808 | 875 | 832 | 985 | 987 | 986 | 1,007 | 906 | 964 | 928 | 896 |
| 2024 | 868 | 801 | ||||||||||
| - = No Data Reported; -- = Not Applicable; NA = Not Available; W = Withheld to avoid disclosure of individual company data. |
| Release Date: 4/30/2024 |
| Next Release Date: 5/31/2024 |