|
Download Data (XLS File) |
|
||||||||
|
||||||||
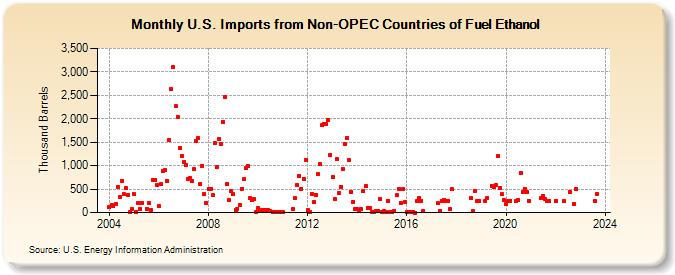
| U.S. Imports from Non-OPEC Countries of Fuel Ethanol (Thousand Barrels) | ||||||||
| Year | Jan | Feb | Mar | Apr | May | Jun | Jul | Aug | Sep | Oct | Nov | Dec |
|---|---|---|---|---|---|---|---|---|---|---|---|---|
| 2004 | 109 | 157 | 143 | 181 | 545 | 337 | 681 | 398 | 518 | 380 | 12 | 81 |
| 2005 | 392 | 13 | 206 | 81 | 211 | 86 | 201 | 61 | 690 | 702 | 591 | |
| 2006 | 132 | 610 | 894 | 905 | 682 | 1,550 | 2,637 | 3,102 | 2,268 | 2,044 | 1,376 | 1,208 |
| 2007 | 1,077 | 1,010 | 720 | 733 | 663 | 922 | 1,533 | 1,586 | 610 | 998 | 393 | 212 |
| 2008 | 510 | 505 | 368 | 1,491 | 962 | 1,571 | 1,459 | 1,931 | 2,466 | 606 | 278 | 463 |
| 2009 | 388 | 56 | 79 | 166 | 507 | 705 | 960 | 983 | 310 | 269 | 285 | 12 |
| 2010 | 90 | 37 | 49 | 46 | 46 | 46 | 25 | 12 | 5 | 4 | 7 | 6 |
| 2011 | 5 | 71 | 305 | 581 | 780 | 507 | 723 | 1,120 | ||||
| 2012 | 46 | 7 | 401 | 226 | 384 | 813 | 1,030 | 1,860 | 1,890 | 1,898 | 1,976 | 1,234 |
| 2013 | 751 | 290 | 1,143 | 416 | 552 | 926 | 1,454 | 1,595 | 1,112 | 439 | 232 | 66 |
| 2014 | 67 | 44 | 74 | 457 | 561 | 100 | 104 | 9 | 7 | 30 | 33 | 292 |
| 2015 | 7 | 39 | 7 | 257 | 8 | 9 | 41 | 367 | 505 | 213 | 498 | 228 |
| 2016 | 3 | 3 | 2 | 3 | 1 | 250 | 314 | 255 | 31 | |||
| 2017 | 197 | 31 | 252 | 269 | 256 | 254 | 69 | 496 | ||||
| 2018 | 304 | 35 | 464 | 236 | 255 | |||||||
| 2019 | 251 | 313 | 574 | 544 | 579 | 1,203 | 522 | 389 | 269 | |||
| 2020 | 176 | 247 | 255 | 250 | 264 | 846 | 438 | 499 | 441 | 254 | ||
| 2021 | 300 | 360 | 286 | 250 | 251 | |||||||
| 2022 | 257 | 250 | 445 | 193 | 500 | |||||||
| 2023 | 249 | 400 | ||||||||||
| - = No Data Reported; -- = Not Applicable; NA = Not Available; W = Withheld to avoid disclosure of individual company data. |
| Release Date: 3/29/2024 |
| Next Release Date: 4/30/2024 |