|
Download Data (XLS File) |
|
||||||||
|
||||||||
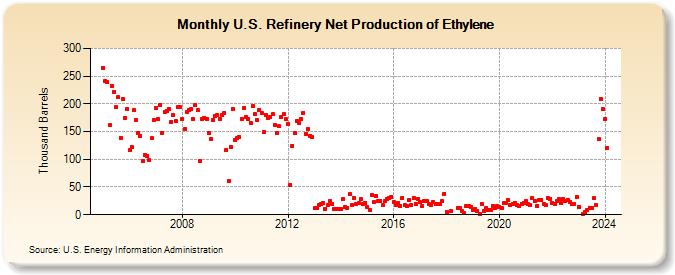
| U.S. Refinery Net Production of Ethylene (Thousand Barrels) | ||||||||
| Year | Jan | Feb | Mar | Apr | May | Jun | Jul | Aug | Sep | Oct | Nov | Dec |
|---|---|---|---|---|---|---|---|---|---|---|---|---|
| 2005 | 265 | 241 | 239 | 161 | 233 | 222 | 194 | 212 | 139 | 209 | 175 | 191 |
| 2006 | 116 | 122 | 189 | 170 | 148 | 142 | 97 | 108 | 106 | 98 | 138 | 171 |
| 2007 | 193 | 172 | 198 | 148 | 185 | 187 | 191 | 168 | 179 | 169 | 194 | 194 |
| 2008 | 173 | 155 | 185 | 188 | 190 | 173 | 197 | 188 | 96 | 172 | 174 | 172 |
| 2009 | 148 | 137 | 171 | 178 | 180 | 173 | 179 | 184 | 117 | 60 | 123 | 190 |
| 2010 | 135 | 138 | 140 | 173 | 192 | 176 | 173 | 165 | 196 | 181 | 170 | 189 |
| 2011 | 184 | 149 | 180 | 174 | 176 | 181 | 162 | 148 | 160 | 176 | 181 | 172 |
| 2012 | 164 | 54 | 124 | 147 | 169 | 165 | 172 | 184 | 146 | 155 | 142 | 140 |
| 2013 | 12 | 12 | 17 | 20 | 22 | 10 | 17 | 25 | 20 | 11 | 10 | 11 |
| 2014 | 10 | 28 | 14 | 13 | 37 | 17 | 31 | 20 | 21 | 29 | 19 | 22 |
| 2015 | 14 | 9 | 36 | 23 | 34 | 24 | 25 | 17 | 25 | 29 | 31 | 32 |
| 2016 | 23 | 18 | 21 | 16 | 31 | 17 | 16 | 27 | 17 | 31 | 19 | 29 |
| 2017 | 23 | 16 | 25 | 25 | 19 | 18 | 23 | 20 | 20 | 19 | 24 | 38 |
| 2018 | 5 | 7 | 12 | 12 | 6 | 3 | 15 | 16 | 14 | |||
| 2019 | 8 | 10 | 7 | 2 | 20 | 7 | 13 | 9 | 8 | 16 | 12 | 15 |
| 2020 | 14 | 12 | 21 | 21 | 26 | 17 | 19 | 21 | 18 | 15 | 20 | 22 |
| 2021 | 24 | 19 | 17 | 30 | 24 | 15 | 26 | 27 | 19 | 17 | 30 | 29 |
| 2022 | 21 | 20 | 24 | 28 | 21 | 28 | 25 | 27 | 23 | 20 | 19 | 32 |
| 2023 | 14 | 1 | 4 | 8 | 13 | 12 | 30 | 17 | 137 | 209 | 191 | |
| 2024 | 173 | |||||||||||
| - = No Data Reported; -- = Not Applicable; NA = Not Available; W = Withheld to avoid disclosure of individual company data. |
| Release Date: 3/29/2024 |
| Next Release Date: 4/30/2024 |
Referring Pages: