|
Download Data (XLS File) |
|
||||||||
|
||||||||
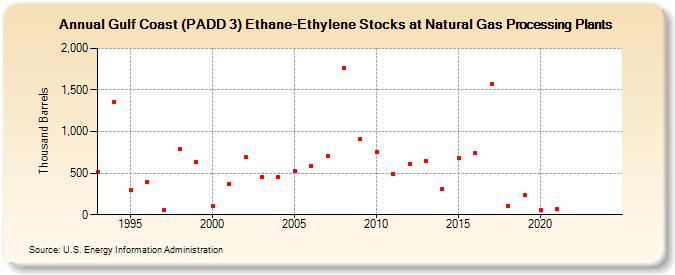
| Gulf Coast (PADD 3) Ethane-Ethylene Stocks at Natural Gas Processing Plants (Thousand Barrels) | ||||||||
| Decade | Year-0 | Year-1 | Year-2 | Year-3 | Year-4 | Year-5 | Year-6 | Year-7 | Year-8 | Year-9 |
|---|---|---|---|---|---|---|---|---|---|---|
| 1990's | 511 | 1,361 | 296 | 388 | 57 | 786 | 628 | |||
| 2000's | 100 | 372 | 689 | 458 | 451 | 523 | 588 | 707 | 1,770 | 908 |
| 2010's | 758 | 493 | 615 | 651 | 314 | 684 | 742 | 1,576 | 107 | 235 |
| 2020's | 59 | 65 | -- | -- |
| - = No Data Reported; -- = Not Applicable; NA = Not Available; W = Withheld to avoid disclosure of individual company data. |
| Release Date: 3/29/2024 |
| Next Release Date: 8/30/2024 |