|
Download Data (XLS File) |
|
||||||||
|
||||||||
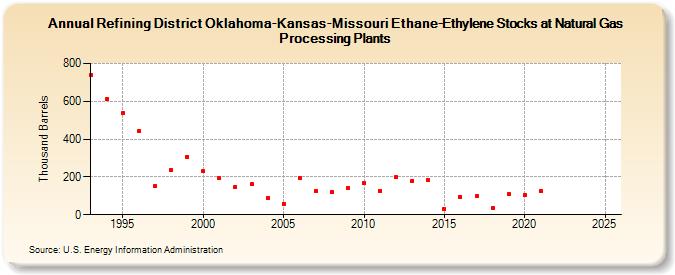
| Refining District Oklahoma-Kansas-Missouri Ethane-Ethylene Stocks at Natural Gas Processing Plants (Thousand Barrels) | ||||||||
| Decade | Year-0 | Year-1 | Year-2 | Year-3 | Year-4 | Year-5 | Year-6 | Year-7 | Year-8 | Year-9 |
|---|---|---|---|---|---|---|---|---|---|---|
| 1990's | 739 | 612 | 537 | 444 | 150 | 236 | 307 | |||
| 2000's | 229 | 192 | 149 | 160 | 88 | 58 | 193 | 126 | 119 | 139 |
| 2010's | 167 | 127 | 197 | 180 | 181 | 31 | 96 | 97 | 37 | 107 |
| 2020's | 106 | 125 | -- | -- |
| - = No Data Reported; -- = Not Applicable; NA = Not Available; W = Withheld to avoid disclosure of individual company data. |
| Release Date: 3/29/2024 |
| Next Release Date: 8/30/2024 |