|
Download Data (XLS File) |
|
||||||||
|
||||||||
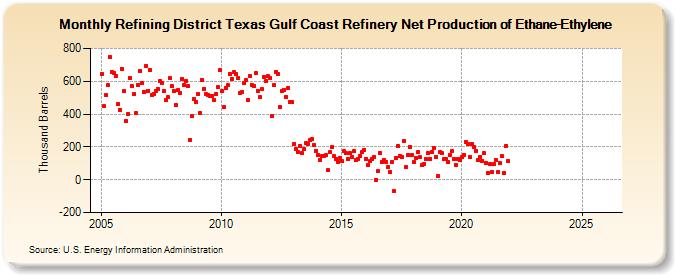
| Refining District Texas Gulf Coast Refinery Net Production of Ethane-Ethylene (Thousand Barrels) | ||||||||
| Year | Jan | Feb | Mar | Apr | May | Jun | Jul | Aug | Sep | Oct | Nov | Dec |
|---|---|---|---|---|---|---|---|---|---|---|---|---|
| 2005 | 647 | 448 | 514 | 574 | 748 | 655 | 652 | 630 | 464 | 426 | 676 | 539 |
| 2006 | 359 | 399 | 621 | 573 | 521 | 406 | 578 | 662 | 590 | 537 | 693 | 541 |
| 2007 | 670 | 517 | 521 | 539 | 553 | 600 | 591 | 541 | 486 | 502 | 618 | 568 |
| 2008 | 540 | 453 | 545 | 528 | 614 | 576 | 602 | 569 | 244 | 388 | 492 | 476 |
| 2009 | 523 | 407 | 609 | 555 | 521 | 518 | 510 | 507 | 487 | 523 | 566 | 666 |
| 2010 | 538 | 440 | 561 | 574 | 646 | 615 | 654 | 645 | 619 | 526 | 532 | 587 |
| 2011 | 607 | 485 | 630 | 579 | 570 | 648 | 542 | 501 | 551 | 627 | 602 | 630 |
| 2012 | 617 | 387 | 574 | 659 | 644 | 440 | 538 | 549 | 504 | 561 | 476 | 473 |
| 2013 | 220 | 187 | 166 | 208 | 162 | 186 | 222 | 217 | 243 | 246 | 210 | 176 |
| 2014 | 150 | 123 | 144 | 145 | 149 | 57 | 166 | 202 | 144 | 125 | 111 | 133 |
| 2015 | 112 | 173 | 160 | 129 | 161 | 139 | 172 | 118 | 129 | 147 | 166 | 183 |
| 2016 | 128 | 92 | 114 | 129 | 141 | 1 | 51 | 164 | 107 | 119 | 105 | 78 |
| 2017 | 47 | 111 | -71 | 134 | 206 | 144 | 137 | 234 | 75 | 151 | 201 | 150 |
| 2018 | 108 | 133 | 168 | 138 | 89 | 98 | 124 | 164 | 129 | 169 | 191 | 141 |
| 2019 | 24 | 169 | 161 | 126 | 125 | 109 | 152 | 174 | 129 | 90 | 128 | 118 |
| 2020 | 136 | 153 | 232 | 218 | 138 | 219 | 198 | 178 | 118 | 140 | 115 | 160 |
| 2021 | 104 | 41 | 93 | 49 | 97 | 120 | 46 | 100 | 144 | 39 | 206 | 115 |
| 2022 | -- | -- | -- | -- | -- | -- | -- | -- | -- | -- | -- | -- |
| 2023 | -- | -- | -- | -- | -- | -- | -- | -- | -- | -- | -- | -- |
| 2024 | -- | |||||||||||
| - = No Data Reported; -- = Not Applicable; NA = Not Available; W = Withheld to avoid disclosure of individual company data. |
| Release Date: 3/29/2024 |
| Next Release Date: 4/30/2024 |