|
Download Data (XLS File) |
|
||||||||
|
||||||||
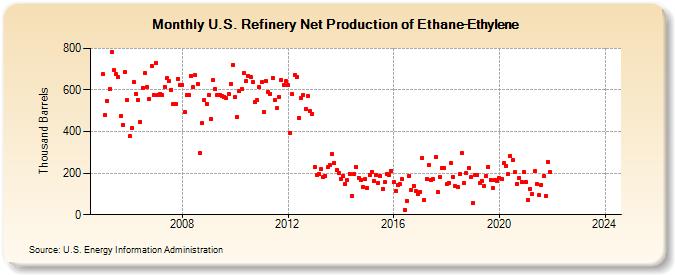
| U.S. Refinery Net Production of Ethane-Ethylene (Thousand Barrels) | ||||||||
| Year | Jan | Feb | Mar | Apr | May | Jun | Jul | Aug | Sep | Oct | Nov | Dec |
|---|---|---|---|---|---|---|---|---|---|---|---|---|
| 2005 | 675 | 478 | 547 | 604 | 783 | 694 | 676 | 662 | 474 | 433 | 688 | 551 |
| 2006 | 377 | 418 | 640 | 582 | 553 | 448 | 610 | 681 | 615 | 558 | 717 | 576 |
| 2007 | 731 | 577 | 583 | 576 | 616 | 656 | 642 | 602 | 531 | 531 | 655 | 623 |
| 2008 | 624 | 493 | 574 | 575 | 667 | 614 | 672 | 630 | 297 | 439 | 552 | 534 |
| 2009 | 577 | 460 | 646 | 604 | 576 | 575 | 571 | 568 | 560 | 580 | 630 | 722 |
| 2010 | 564 | 469 | 595 | 603 | 682 | 644 | 668 | 663 | 636 | 540 | 550 | 614 |
| 2011 | 637 | 495 | 643 | 590 | 582 | 659 | 550 | 512 | 568 | 647 | 624 | 641 |
| 2012 | 624 | 393 | 580 | 673 | 662 | 465 | 560 | 576 | 510 | 571 | 497 | 486 |
| 2013 | 229 | 192 | 195 | 218 | 182 | 187 | 228 | 237 | 292 | 249 | 216 | 201 |
| 2014 | 172 | 186 | 148 | 166 | 198 | 92 | 197 | 231 | 178 | 165 | 135 | 170 |
| 2015 | 128 | 193 | 207 | 160 | 193 | 154 | 188 | 125 | 155 | 198 | 190 | 212 |
| 2016 | 155 | 114 | 141 | 146 | 170 | 25 | 68 | 186 | 121 | 140 | 115 | 100 |
| 2017 | 111 | 275 | 73 | 173 | 238 | 169 | 170 | 277 | 110 | 183 | 226 | 223 |
| 2018 | 146 | 153 | 249 | 182 | 138 | 133 | 195 | 295 | 152 | 199 | 227 | 181 |
| 2019 | 57 | 193 | 189 | 152 | 164 | 138 | 186 | 230 | 168 | 129 | 166 | 161 |
| 2020 | 176 | 170 | 251 | 236 | 194 | 282 | 261 | 204 | 150 | 176 | 158 | 204 |
| 2021 | 155 | 73 | 124 | 99 | 208 | 148 | 94 | 144 | 185 | 92 | 255 | 205 |
| 2022 | -- | -- | -- | -- | -- | -- | -- | -- | -- | -- | -- | -- |
| 2023 | -- | -- | -- | -- | -- | -- | -- | -- | -- | -- | -- | -- |
| 2024 | -- | |||||||||||
| - = No Data Reported; -- = Not Applicable; NA = Not Available; W = Withheld to avoid disclosure of individual company data. |
| Release Date: 3/29/2024 |
| Next Release Date: 4/30/2024 |
Referring Pages: