|
Download Data (XLS File) |
|
||||||||
|
||||||||
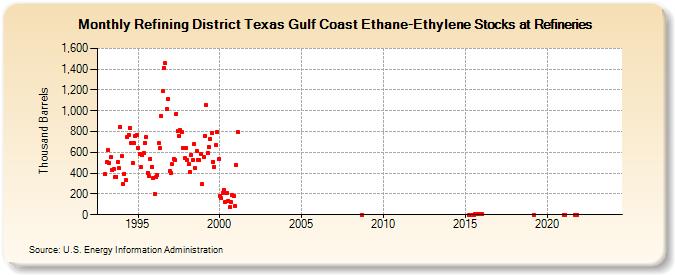
| Refining District Texas Gulf Coast Ethane-Ethylene Stocks at Refineries (Thousand Barrels) | ||||||||
| Year | Jan | Feb | Mar | Apr | May | Jun | Jul | Aug | Sep | Oct | Nov | Dec |
|---|---|---|---|---|---|---|---|---|---|---|---|---|
| 1993 | 387 | 503 | 619 | 499 | 555 | 427 | 435 | 360 | 363 | 508 | 445 | 847 |
| 1994 | 566 | 294 | 396 | 330 | 744 | 770 | 837 | 686 | 499 | 687 | 755 | 771 |
| 1995 | 645 | 587 | 456 | 571 | 593 | 694 | 743 | 402 | 368 | 535 | 462 | 350 |
| 1996 | 204 | 363 | 378 | 686 | 638 | 947 | 1,189 | 1,414 | 1,455 | 1,018 | 1,113 | 418 |
| 1997 | 403 | 484 | 536 | 528 | 972 | 801 | 762 | 813 | 797 | 640 | 545 | 644 |
| 1998 | 522 | 487 | 411 | 577 | 527 | 682 | 447 | 614 | 528 | 523 | 586 | 294 |
| 1999 | 559 | 758 | 1,055 | 594 | 653 | 726 | 784 | 510 | 460 | 670 | 795 | 534 |
| 2000 | 180 | 158 | 212 | 238 | 122 | 209 | 132 | 74 | 119 | 188 | 176 | 86 |
| 2001 | 480 | 791 | ||||||||||
| 2008 | 1 | |||||||||||
| 2015 | 1 | 1 | 1 | 1 | 3 | 3 | 3 | 3 | 4 | |||
| 2016 | 6 | |||||||||||
| 2019 | 1 | |||||||||||
| 2021 | 1 | 1 | 1 | 1 | 1 | |||||||
| 2022 | -- | -- | -- | -- | -- | -- | -- | -- | -- | -- | -- | |
| 2023 | -- | -- | -- | -- | -- | -- | -- | -- | -- | -- | -- | -- |
| 2024 | -- | |||||||||||
| - = No Data Reported; -- = Not Applicable; NA = Not Available; W = Withheld to avoid disclosure of individual company data. |
| Release Date: 3/29/2024 |
| Next Release Date: 4/30/2024 |
Referring Pages: