|
Download Data (XLS File) |
|
||||||||
|
||||||||
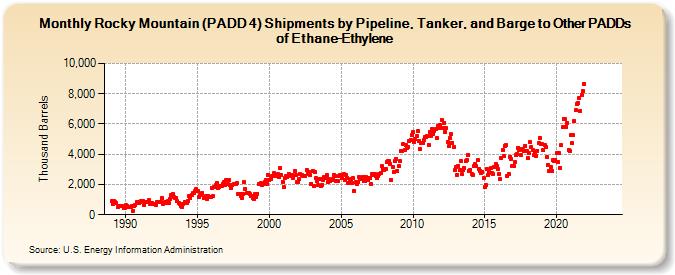
| Rocky Mountain (PADD 4) Shipments by Pipeline, Tanker, and Barge to Other PADDs of Ethane-Ethylene (Thousand Barrels) | ||||||||
| Year | Jan | Feb | Mar | Apr | May | Jun | Jul | Aug | Sep | Oct | Nov | Dec |
|---|---|---|---|---|---|---|---|---|---|---|---|---|
| 1989 | 895 | 719 | 884 | 833 | 743 | 504 | 563 | 577 | 544 | 563 | 450 | 472 |
| 1990 | 621 | 601 | 507 | 543 | 535 | 588 | 263 | 580 | 627 | 830 | 810 | 754 |
| 1991 | 811 | 902 | 895 | 675 | 845 | 864 | 841 | 951 | 676 | 766 | 747 | 711 |
| 1992 | 695 | 664 | 833 | 833 | 838 | 864 | 1,119 | 702 | 787 | 820 | 798 | 889 |
| 1993 | 763 | 1,043 | 1,288 | 1,382 | 1,185 | 1,135 | 1,119 | 886 | 795 | 701 | 587 | 501 |
| 1994 | 711 | 842 | 844 | 805 | 895 | 1,208 | 1,135 | 1,335 | 1,424 | 1,458 | 1,599 | 1,693 |
| 1995 | 1,564 | 1,180 | 1,295 | 1,325 | 1,462 | 1,102 | 1,174 | 1,206 | 1,066 | 1,221 | 1,175 | 1,188 |
| 1996 | 1,796 | 1,218 | 1,855 | 1,964 | 2,118 | 1,738 | 1,807 | 1,910 | 1,882 | 2,017 | 2,143 | 1,970 |
| 1997 | 2,269 | 2,002 | 2,323 | 1,983 | 1,757 | 1,964 | 1,999 | 2,032 | 2,046 | 2,074 | 1,379 | 1,345 |
| 1998 | 1,270 | 1,130 | 1,372 | 2,142 | 1,715 | 1,431 | 1,444 | 1,405 | 1,352 | 1,267 | 1,117 | 1,032 |
| 1999 | 1,350 | 1,172 | 1,392 | 2,000 | 2,060 | 2,069 | 1,946 | 2,023 | 2,193 | 2,324 | 2,061 | 2,651 |
| 2000 | 2,287 | 2,349 | 2,528 | 2,553 | 2,751 | 2,648 | 2,579 | 2,666 | 2,471 | 3,074 | 2,644 | 2,192 |
| 2001 | 1,809 | 2,415 | 2,537 | 2,520 | 2,709 | 2,610 | 2,578 | 2,639 | 2,460 | 2,866 | 2,595 | 2,192 |
| 2002 | 2,184 | 2,343 | 2,663 | 2,631 | 2,580 | 2,532 | 2,575 | 2,967 | 2,697 | 2,819 | 2,633 | 2,058 |
| 2003 | 2,875 | 1,912 | 2,825 | 2,399 | 2,223 | 1,960 | 2,372 | 1,886 | 1,971 | 2,317 | 2,465 | 2,430 |
| 2004 | 2,614 | 2,176 | 2,344 | 2,227 | 2,284 | 2,391 | 2,659 | 2,558 | 2,240 | 2,246 | 2,553 | 2,604 |
| 2005 | 2,622 | 2,442 | 2,669 | 2,269 | 2,643 | 2,433 | 2,115 | 2,269 | 2,332 | 2,120 | 2,402 | 1,576 |
| 2006 | 2,139 | 2,010 | 2,140 | 2,516 | 2,368 | 2,367 | 2,475 | 2,259 | 2,221 | 2,473 | 2,292 | 2,406 |
| 2007 | 2,411 | 2,046 | 2,689 | 2,651 | 2,668 | 2,549 | 2,400 | 2,561 | 2,686 | 2,769 | 3,203 | 2,990 |
| 2008 | 2,983 | 3,003 | 3,495 | 3,540 | 3,539 | 3,357 | 2,286 | 3,168 | 2,834 | 3,547 | 3,685 | 2,916 |
| 2009 | 3,216 | 3,520 | 4,244 | 4,181 | 4,656 | 4,280 | 4,617 | 4,393 | 4,509 | 4,861 | 4,946 | 5,241 |
| 2010 | 5,460 | 4,793 | 4,998 | 5,197 | 5,519 | 4,876 | 4,328 | 4,772 | 4,747 | 4,922 | 5,111 | 5,149 |
| 2011 | 5,191 | 4,626 | 5,475 | 5,225 | 5,681 | 5,351 | 5,544 | 5,672 | 5,081 | 5,864 | 5,702 | 5,924 |
| 2012 | 6,294 | 5,733 | 6,089 | 5,496 | 5,725 | 4,819 | 4,518 | 5,044 | 5,320 | 4,767 | 4,479 | 2,930 |
| 2013 | 3,139 | 2,643 | 3,229 | 2,940 | 3,544 | 2,666 | 2,939 | 3,084 | 3,549 | 3,649 | 3,952 | 2,913 |
| 2014 | 2,985 | 2,710 | 2,625 | 3,232 | 3,346 | 3,207 | 3,615 | 3,038 | 2,921 | 2,751 | 2,847 | 2,411 |
| 2015 | 1,811 | 1,991 | 3,015 | 2,604 | 2,844 | 3,071 | 2,740 | 2,721 | 3,158 | 3,351 | 3,207 | 3,020 |
| 2016 | 2,686 | 2,358 | 3,773 | 4,285 | 3,865 | 4,565 | 4,604 | 2,554 | 2,689 | 3,818 | 3,679 | 3,221 |
| 2017 | 3,202 | 3,465 | 3,931 | 3,984 | 4,441 | 4,279 | 3,935 | 4,363 | 4,255 | 4,241 | 4,575 | 4,238 |
| 2018 | 3,738 | 4,109 | 4,776 | 4,481 | 4,292 | 3,969 | 4,136 | 3,884 | 4,242 | 4,726 | 5,079 | 4,699 |
| 2019 | 4,666 | 4,261 | 4,619 | 4,452 | 3,829 | 3,264 | 2,883 | 3,187 | 2,863 | 3,598 | 3,532 | 3,649 |
| 2020 | 4,061 | 3,476 | 4,064 | 3,093 | 4,590 | 5,777 | 6,338 | 6,358 | 5,832 | 6,090 | 4,291 | 4,208 |
| 2021 | 5,269 | 4,736 | 5,244 | 6,210 | 6,894 | 7,333 | 7,402 | 7,707 | 6,850 | 7,930 | 8,162 | 8,649 |
| 2022 | -- | -- | -- | -- | -- | -- | -- | -- | -- | -- | -- | -- |
| 2023 | -- | -- | -- | -- | -- | -- | -- | -- | -- | -- | -- | -- |
| 2024 | -- | |||||||||||
| - = No Data Reported; -- = Not Applicable; NA = Not Available; W = Withheld to avoid disclosure of individual company data. |
| Release Date: 3/29/2024 |
| Next Release Date: 4/30/2024 |