|
Download Data (XLS File) |
|
||||||||
|
||||||||
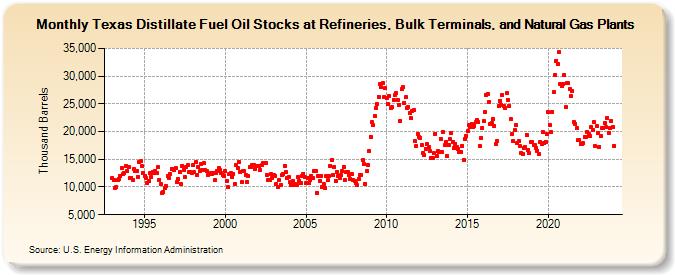
| Texas Distillate Fuel Oil Stocks at Refineries, Bulk Terminals, and Natural Gas Plants (Thousand Barrels) | ||||||||
| Year | Jan | Feb | Mar | Apr | May | Jun | Jul | Aug | Sep | Oct | Nov | Dec |
|---|---|---|---|---|---|---|---|---|---|---|---|---|
| 1993 | 11,616 | 11,318 | 9,879 | 9,988 | 11,175 | 11,442 | 11,968 | 13,475 | 12,297 | 12,488 | 13,754 | 12,847 |
| 1994 | 13,638 | 11,542 | 11,700 | 11,252 | 13,277 | 12,868 | 12,851 | 11,877 | 14,445 | 14,631 | 13,729 | 12,573 |
| 1995 | 12,060 | 11,575 | 10,769 | 11,028 | 12,513 | 11,842 | 12,780 | 12,588 | 12,946 | 12,614 | 13,536 | 11,341 |
| 1996 | 10,528 | 8,915 | 9,162 | 9,815 | 10,144 | 11,898 | 11,658 | 12,341 | 13,265 | 13,313 | 13,058 | 13,403 |
| 1997 | 10,814 | 11,392 | 12,750 | 10,621 | 13,871 | 13,129 | 11,824 | 13,690 | 13,940 | 12,745 | 12,736 | 12,572 |
| 1998 | 13,920 | 12,654 | 14,440 | 12,159 | 13,578 | 12,808 | 14,152 | 13,139 | 14,357 | 13,006 | 12,837 | 12,239 |
| 1999 | 12,393 | 12,607 | 12,423 | 12,540 | 11,176 | 12,434 | 12,842 | 13,366 | 13,127 | 12,450 | 12,181 | 12,042 |
| 2000 | 12,817 | 11,094 | 9,910 | 12,340 | 12,439 | 11,883 | 12,426 | 10,571 | 13,896 | 13,439 | 14,535 | 12,621 |
| 2001 | 10,811 | 12,826 | 12,827 | 12,236 | 10,962 | 11,978 | 13,588 | 13,570 | 13,931 | 13,887 | 13,308 | 13,709 |
| 2002 | 13,705 | 13,741 | 13,021 | 13,953 | 14,239 | 14,388 | 14,360 | 12,240 | 11,338 | 11,248 | 12,343 | 11,633 |
| 2003 | 12,091 | 12,027 | 10,473 | 10,068 | 11,284 | 10,395 | 12,079 | 12,344 | 13,868 | 12,705 | 11,712 | 11,767 |
| 2004 | 10,823 | 10,429 | 11,111 | 10,444 | 10,529 | 10,419 | 11,771 | 11,136 | 10,672 | 11,961 | 12,413 | 11,771 |
| 2005 | 10,671 | 11,540 | 10,705 | 11,259 | 12,068 | 11,556 | 12,963 | 12,903 | 8,944 | 12,003 | 11,159 | 12,049 |
| 2006 | 9,968 | 10,627 | 9,772 | 11,968 | 11,189 | 12,018 | 13,857 | 14,872 | 12,154 | 13,629 | 11,164 | 12,747 |
| 2007 | 11,915 | 11,683 | 12,211 | 12,820 | 13,676 | 11,231 | 12,727 | 12,653 | 12,176 | 11,415 | 12,325 | 11,315 |
| 2008 | 11,146 | 10,760 | 10,292 | 11,487 | 12,230 | 12,142 | 14,806 | 14,100 | 10,610 | 12,872 | 13,941 | 16,454 |
| 2009 | 19,080 | 21,669 | 21,117 | 22,737 | 24,311 | 24,884 | 26,322 | 28,660 | 27,967 | 28,714 | 26,267 | 27,866 |
| 2010 | 25,968 | 24,952 | 26,495 | 24,252 | 24,380 | 25,736 | 26,551 | 26,935 | 25,779 | 24,825 | 21,928 | 27,675 |
| 2011 | 27,961 | 25,149 | 26,174 | 24,267 | 24,397 | 23,359 | 22,427 | 23,687 | 23,833 | 18,262 | 17,430 | 19,604 |
| 2012 | 19,078 | 18,874 | 17,605 | 16,172 | 15,702 | 16,924 | 17,674 | 17,206 | 16,422 | 15,314 | 15,314 | 16,077 |
| 2013 | 19,625 | 15,534 | 16,415 | 16,347 | 18,705 | 16,287 | 19,879 | 17,567 | 18,173 | 15,630 | 17,526 | 18,654 |
| 2014 | 19,754 | 18,189 | 17,039 | 17,822 | 17,248 | 16,825 | 16,364 | 16,383 | 17,436 | 14,894 | 18,721 | 19,268 |
| 2015 | 20,080 | 21,121 | 20,879 | 21,406 | 20,807 | 21,067 | 21,649 | 22,096 | 21,711 | 17,423 | 18,883 | 20,684 |
| 2016 | 21,892 | 23,541 | 26,682 | 26,847 | 25,387 | 21,389 | 21,587 | 22,241 | 21,036 | 17,678 | 18,379 | 24,613 |
| 2017 | 25,600 | 24,866 | 26,580 | 24,668 | 24,207 | 26,929 | 25,738 | 24,533 | 22,218 | 19,593 | 18,219 | 20,278 |
| 2018 | 21,232 | 17,913 | 18,258 | 17,413 | 16,096 | 16,025 | 17,080 | 17,142 | 19,406 | 16,634 | 16,084 | 18,143 |
| 2019 | 18,039 | 17,640 | 17,493 | 17,037 | 16,525 | 15,962 | 18,139 | 17,742 | 19,901 | 17,846 | 18,161 | 19,532 |
| 2020 | 23,487 | 21,209 | 19,842 | 23,566 | 27,074 | 30,235 | 32,774 | 32,177 | 34,382 | 28,554 | 28,144 | 28,659 |
| 2021 | 30,187 | 24,414 | 28,694 | 28,703 | 27,653 | 26,386 | 27,358 | 21,704 | 21,407 | 20,590 | 18,425 | 18,500 |
| 2022 | 17,826 | 17,783 | 17,847 | 19,091 | 19,040 | 19,947 | 19,530 | 19,195 | 20,733 | 20,269 | 21,717 | 17,315 |
| 2023 | 21,001 | 19,752 | 17,295 | 19,197 | 20,647 | 20,576 | 21,537 | 20,764 | 22,460 | 19,794 | 20,726 | 21,861 |
| 2024 | 20,800 | |||||||||||
| - = No Data Reported; -- = Not Applicable; NA = Not Available; W = Withheld to avoid disclosure of individual company data. |
| Release Date: 3/29/2024 |
| Next Release Date: 4/30/2024 |