|
Download Data (XLS File) |
|
||||||||
|
||||||||
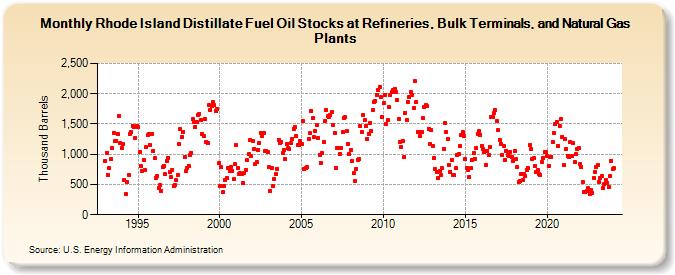
| Rhode Island Distillate Fuel Oil Stocks at Refineries, Bulk Terminals, and Natural Gas Plants (Thousand Barrels) | ||||||||
| Year | Jan | Feb | Mar | Apr | May | Jun | Jul | Aug | Sep | Oct | Nov | Dec |
|---|---|---|---|---|---|---|---|---|---|---|---|---|
| 1993 | 896 | 1,028 | 657 | 768 | 923 | 1,103 | 1,358 | 1,215 | 1,226 | 1,333 | 1,631 | 1,192 |
| 1994 | 1,106 | 1,172 | 575 | 342 | 533 | 657 | 1,339 | 1,363 | 1,473 | 1,454 | 1,271 | 1,469 |
| 1995 | 1,447 | 1,032 | 803 | 724 | 910 | 731 | 1,112 | 1,319 | 1,331 | 1,151 | 1,342 | 1,061 |
| 1996 | 933 | 614 | 642 | 442 | 494 | 385 | 787 | 799 | 666 | 881 | 945 | 704 |
| 1997 | 622 | 743 | 482 | 498 | 566 | 656 | 1,173 | 1,416 | 1,290 | 1,372 | 949 | 716 |
| 1998 | 776 | 807 | 995 | 1,028 | 1,575 | 1,535 | 1,452 | 1,536 | 1,655 | 1,671 | 1,570 | 1,335 |
| 1999 | 1,296 | 1,576 | 1,210 | 1,180 | 1,810 | 1,733 | 1,805 | 1,858 | 1,809 | 1,721 | 1,746 | 849 |
| 2000 | 468 | 787 | 374 | 471 | 582 | 609 | 775 | 726 | 796 | 727 | 585 | 834 |
| 2001 | 1,150 | 774 | 678 | 688 | 670 | 527 | 693 | 743 | 900 | 1,001 | 1,236 | 972 |
| 2002 | 1,218 | 1,083 | 843 | 870 | 1,076 | 1,187 | 1,351 | 1,305 | 1,346 | 1,061 | 1,055 | 1,036 |
| 2003 | 786 | 393 | 766 | 476 | 593 | 670 | 763 | 1,240 | 1,188 | 1,208 | 1,020 | 1,062 |
| 2004 | 923 | 1,177 | 1,100 | 1,094 | 1,182 | 1,259 | 1,425 | 1,449 | 1,294 | 1,155 | 1,155 | 1,222 |
| 2005 | 1,161 | 1,546 | 749 | 766 | 781 | 1,257 | 1,346 | 1,716 | 1,594 | 1,282 | 1,378 | 1,482 |
| 2006 | 1,261 | 995 | 862 | 1,012 | 1,203 | 1,544 | 1,729 | 1,624 | 1,608 | 1,641 | 1,706 | 1,489 |
| 2007 | 1,356 | 779 | 1,100 | 1,107 | 1,009 | 1,105 | 1,374 | 1,595 | 1,611 | 1,384 | 1,170 | 998 |
| 2008 | 1,073 | 887 | 683 | 555 | 763 | 909 | 919 | 1,466 | 1,375 | 1,650 | 1,559 | 1,473 |
| 2009 | 1,249 | 1,334 | 1,509 | 1,382 | 1,737 | 1,864 | 1,883 | 1,984 | 2,063 | 2,108 | 1,941 | 1,623 |
| 2010 | 1,846 | 1,980 | 1,506 | 1,560 | 1,778 | 1,971 | 2,022 | 2,064 | 2,070 | 2,033 | 1,898 | 1,575 |
| 2011 | 1,203 | 1,122 | 1,223 | 953 | 1,678 | 1,570 | 1,871 | 1,940 | 2,021 | 1,975 | 1,768 | 2,205 |
| 2012 | 1,861 | 1,375 | 1,360 | 1,296 | 1,366 | 1,595 | 1,774 | 1,817 | 1,790 | 1,425 | 1,175 | 1,400 |
| 2013 | 1,142 | 932 | 754 | 701 | 601 | 720 | 649 | 767 | 1,093 | 1,509 | 1,374 | 1,247 |
| 2014 | 818 | 714 | 909 | 649 | 651 | 767 | 988 | 1,003 | 1,142 | 1,312 | 1,367 | 1,298 |
| 2015 | 915 | 774 | 739 | 625 | 764 | 908 | 1,022 | 929 | 1,096 | 1,335 | 1,378 | 1,318 |
| 2016 | 1,142 | 1,082 | 1,043 | 825 | 1,057 | 991 | 1,127 | 1,621 | 1,616 | 1,679 | 1,725 | 1,548 |
| 2017 | 1,394 | 1,236 | 1,174 | 993 | 1,142 | 909 | 1,061 | 981 | 967 | 1,036 | 956 | 891 |
| 2018 | 1,051 | 916 | 782 | 535 | 552 | 678 | 579 | 673 | 642 | 744 | 770 | 1,156 |
| 2019 | 1,081 | 918 | 933 | 809 | 706 | 735 | 669 | 660 | 871 | 941 | 1,040 | 1,031 |
| 2020 | 969 | 803 | 957 | 960 | 1,195 | 1,347 | 1,503 | 1,538 | 1,141 | 1,469 | 1,580 | 1,290 |
| 2021 | 817 | 1,250 | 1,084 | 964 | 956 | 1,200 | 973 | 1,179 | 878 | 1,005 | 1,080 | 1,100 |
| 2022 | 842 | 787 | 547 | 379 | 372 | 384 | 437 | 335 | 402 | 361 | 613 | 709 |
| 2023 | 787 | 816 | 542 | 613 | 642 | 445 | 504 | 572 | 532 | 466 | 632 | 890 |
| 2024 | 761 | |||||||||||
| - = No Data Reported; -- = Not Applicable; NA = Not Available; W = Withheld to avoid disclosure of individual company data. |
| Release Date: 3/29/2024 |
| Next Release Date: 4/30/2024 |