|
Download Data (XLS File) |
|
||||||||
|
||||||||
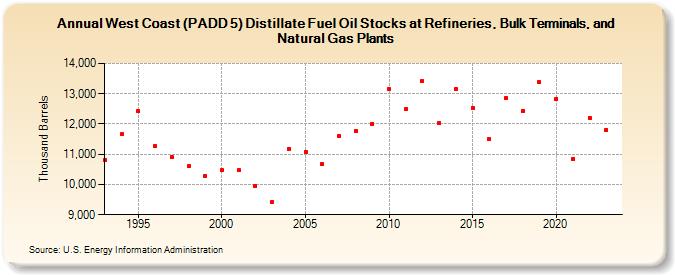
| West Coast (PADD 5) Distillate Fuel Oil Stocks at Refineries, Bulk Terminals, and Natural Gas Plants (Thousand Barrels) | ||||||||
| Decade | Year-0 | Year-1 | Year-2 | Year-3 | Year-4 | Year-5 | Year-6 | Year-7 | Year-8 | Year-9 |
|---|---|---|---|---|---|---|---|---|---|---|
| 1990's | 10,817 | 11,659 | 12,418 | 11,261 | 10,901 | 10,599 | 10,293 | |||
| 2000's | 10,464 | 10,469 | 9,952 | 9,428 | 11,179 | 11,086 | 10,676 | 11,606 | 11,776 | 12,015 |
| 2010's | 13,150 | 12,494 | 13,429 | 12,033 | 13,159 | 12,536 | 11,500 | 12,862 | 12,440 | 13,376 |
| 2020's | 12,838 | 10,847 | 12,211 | 11,809 |
| - = No Data Reported; -- = Not Applicable; NA = Not Available; W = Withheld to avoid disclosure of individual company data. |
| Release Date: 8/30/2024 |
| Next Release Date: 8/29/2025 |