|
Download Data (XLS File) |
|
||||||||
|
||||||||
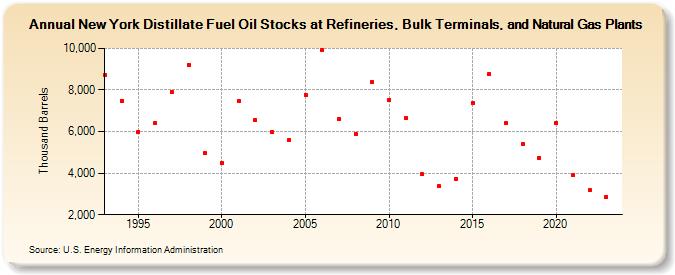
| New York Distillate Fuel Oil Stocks at Refineries, Bulk Terminals, and Natural Gas Plants (Thousand Barrels) | ||||||||
| Decade | Year-0 | Year-1 | Year-2 | Year-3 | Year-4 | Year-5 | Year-6 | Year-7 | Year-8 | Year-9 |
|---|---|---|---|---|---|---|---|---|---|---|
| 1990's | 8,709 | 7,492 | 5,995 | 6,425 | 7,909 | 9,224 | 4,953 | |||
| 2000's | 4,490 | 7,454 | 6,547 | 5,956 | 5,573 | 7,776 | 9,946 | 6,617 | 5,882 | 8,378 |
| 2010's | 7,539 | 6,655 | 3,943 | 3,361 | 3,732 | 7,374 | 8,768 | 6,411 | 5,414 | 4,725 |
| 2020's | 6,402 | 3,898 | 3,171 | 2,874 |
| - = No Data Reported; -- = Not Applicable; NA = Not Available; W = Withheld to avoid disclosure of individual company data. |
| Release Date: 8/30/2024 |
| Next Release Date: 8/29/2025 |