|
Download Data (XLS File) |
|
||||||||
|
||||||||
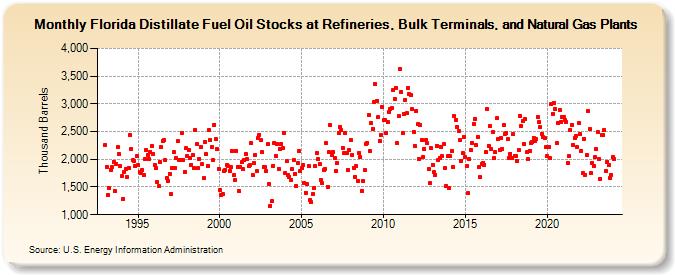
| Florida Distillate Fuel Oil Stocks at Refineries, Bulk Terminals, and Natural Gas Plants (Thousand Barrels) | ||||||||
| Year | Jan | Feb | Mar | Apr | May | Jun | Jul | Aug | Sep | Oct | Nov | Dec |
|---|---|---|---|---|---|---|---|---|---|---|---|---|
| 1993 | 2,265 | 1,868 | 1,357 | 1,473 | 1,813 | 1,857 | 1,958 | 1,425 | 1,920 | 2,219 | 2,099 | 1,873 |
| 1994 | 1,692 | 1,288 | 1,777 | 1,827 | 1,682 | 1,847 | 2,441 | 2,189 | 1,982 | 1,964 | 1,879 | 2,054 |
| 1995 | 1,890 | 1,776 | 1,748 | 1,809 | 1,711 | 2,005 | 2,168 | 2,083 | 1,997 | 2,138 | 2,235 | 2,104 |
| 1996 | 1,891 | 1,844 | 1,583 | 1,511 | 1,958 | 2,216 | 2,334 | 2,345 | 1,979 | 1,659 | 1,617 | 1,739 |
| 1997 | 1,366 | 1,835 | 2,123 | 1,836 | 2,017 | 2,322 | 1,993 | 1,994 | 2,475 | 1,985 | 1,779 | 2,195 |
| 1998 | 2,063 | 2,160 | 2,021 | 1,905 | 2,077 | 1,846 | 2,529 | 2,267 | 1,836 | 2,011 | 2,218 | 1,910 |
| 1999 | 1,657 | 2,311 | 2,091 | 1,882 | 2,526 | 2,354 | 2,217 | 1,982 | 2,625 | 2,365 | 2,182 | 1,833 |
| 2000 | 1,446 | 1,360 | 1,370 | 1,782 | 1,813 | 1,895 | 1,870 | 1,797 | 1,852 | 2,153 | 1,716 | 1,635 |
| 2001 | 2,157 | 1,864 | 1,423 | 1,865 | 1,942 | 1,823 | 1,981 | 2,089 | 1,997 | 1,872 | 1,893 | 2,288 |
| 2002 | 1,719 | 1,929 | 2,073 | 1,787 | 2,383 | 2,444 | 2,350 | 2,130 | 1,869 | 1,863 | 1,792 | 2,271 |
| 2003 | 1,557 | 1,164 | 1,239 | 1,886 | 2,301 | 2,061 | 2,271 | 1,832 | 2,193 | 2,277 | 2,198 | 2,478 |
| 2004 | 1,750 | 1,967 | 1,724 | 1,683 | 1,631 | 1,826 | 1,979 | 1,741 | 1,519 | 1,931 | 2,141 | 1,786 |
| 2005 | 1,845 | 1,888 | 1,569 | 1,399 | 1,545 | 1,880 | 1,264 | 1,229 | 1,375 | 1,489 | 1,870 | 2,115 |
| 2006 | 2,004 | 1,914 | 1,634 | 1,569 | 1,805 | 1,825 | 2,287 | 1,503 | 2,125 | 2,615 | 2,079 | 2,128 |
| 2007 | 2,027 | 1,783 | 1,935 | 2,472 | 2,579 | 2,532 | 2,209 | 2,118 | 2,468 | 2,115 | 1,806 | 2,161 |
| 2008 | 2,342 | 2,077 | 1,848 | 1,683 | 1,870 | 1,616 | 2,109 | 2,037 | 1,436 | 1,608 | 1,804 | 2,279 |
| 2009 | 2,294 | 2,790 | 2,151 | 2,646 | 2,552 | 3,036 | 3,356 | 3,059 | 2,756 | 2,323 | 2,437 | 2,948 |
| 2010 | 2,701 | 2,701 | 2,482 | 2,676 | 2,846 | 2,907 | 2,920 | 3,249 | 3,094 | 3,291 | 2,286 | 2,774 |
| 2011 | 3,635 | 3,209 | 2,470 | 2,823 | 3,078 | 2,830 | 3,290 | 3,179 | 3,152 | 2,902 | 2,489 | 2,242 |
| 2012 | 2,872 | 2,629 | 2,013 | 2,618 | 2,344 | 2,037 | 2,191 | 2,348 | 2,287 | 1,822 | 1,565 | 2,197 |
| 2013 | 1,902 | 1,770 | 1,724 | 2,246 | 1,990 | 2,023 | 2,226 | 2,051 | 2,270 | 1,838 | 1,517 | 2,053 |
| 2014 | 1,485 | 2,053 | 2,148 | 1,869 | 2,780 | 2,713 | 2,590 | 2,516 | 2,339 | 1,974 | 2,112 | 2,410 |
| 2015 | 2,033 | 1,875 | 1,385 | 2,000 | 2,168 | 2,297 | 2,645 | 2,732 | 2,249 | 2,409 | 1,860 | 1,673 |
| 2016 | 1,917 | 1,940 | 1,905 | 2,131 | 2,902 | 2,247 | 2,597 | 2,183 | 2,483 | 2,030 | 2,125 | 2,738 |
| 2017 | 2,363 | 2,171 | 2,389 | 2,193 | 2,621 | 2,447 | 2,465 | 2,359 | 2,024 | 2,104 | 2,023 | 2,448 |
| 2018 | 2,063 | 2,061 | 1,967 | 2,176 | 2,788 | 2,608 | 2,692 | 2,279 | 2,720 | 2,124 | 2,000 | 2,156 |
| 2019 | 2,296 | 2,318 | 2,392 | 2,333 | 2,359 | 2,760 | 2,664 | 2,580 | 2,463 | 2,397 | 2,384 | 2,213 |
| 2020 | 2,060 | 2,221 | 2,015 | 3,000 | 2,818 | 3,021 | 2,904 | 2,288 | 2,657 | 2,893 | 2,678 | 2,767 |
| 2021 | 2,754 | 2,701 | 2,674 | 1,930 | 2,063 | 2,524 | 2,624 | 2,263 | 2,384 | 2,426 | 2,218 | 2,658 |
| 2022 | 2,454 | 2,146 | 1,744 | 2,374 | 1,718 | 2,081 | 2,864 | 2,542 | 1,745 | 1,936 | 1,884 | 2,036 |
| 2023 | 2,189 | 2,486 | 2,001 | 1,651 | 2,438 | 2,429 | 2,527 | 1,790 | 1,958 | 1,893 | 1,670 | 1,721 |
| 2024 | 2,035 | |||||||||||
| - = No Data Reported; -- = Not Applicable; NA = Not Available; W = Withheld to avoid disclosure of individual company data. |
| Release Date: 3/29/2024 |
| Next Release Date: 4/30/2024 |