|
Download Data (XLS File) |
|
||||||||
|
||||||||
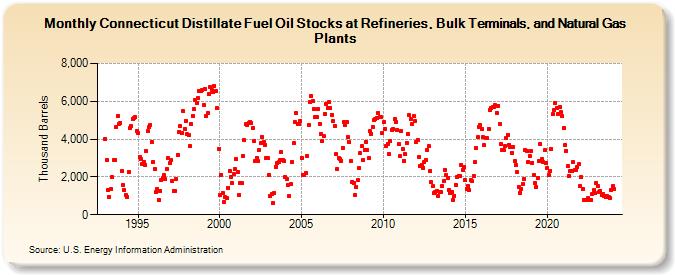
| Connecticut Distillate Fuel Oil Stocks at Refineries, Bulk Terminals, and Natural Gas Plants (Thousand Barrels) | ||||||||
| Year | Jan | Feb | Mar | Apr | May | Jun | Jul | Aug | Sep | Oct | Nov | Dec |
|---|---|---|---|---|---|---|---|---|---|---|---|---|
| 1993 | 3,995 | 2,899 | 1,290 | 952 | 1,357 | 1,974 | 2,894 | 2,888 | 4,647 | 5,243 | 4,791 | 4,873 |
| 1994 | 2,319 | 1,564 | 1,284 | 1,046 | 944 | 2,261 | 4,564 | 4,689 | 5,078 | 5,135 | 5,149 | 4,433 |
| 1995 | 4,339 | 3,037 | 2,927 | 2,694 | 2,781 | 2,646 | 3,372 | 4,408 | 4,621 | 4,743 | 3,851 | 2,799 |
| 1996 | 2,423 | 1,203 | 1,356 | 776 | 1,275 | 1,846 | 1,923 | 2,086 | 1,875 | 2,427 | 2,977 | 2,712 |
| 1997 | 2,908 | 1,809 | 1,260 | 1,269 | 1,882 | 3,168 | 4,400 | 4,683 | 4,312 | 5,461 | 4,545 | 4,963 |
| 1998 | 4,252 | 4,196 | 3,645 | 4,781 | 5,223 | 5,572 | 6,072 | 5,926 | 6,172 | 6,534 | 6,538 | 6,603 |
| 1999 | 5,813 | 6,674 | 5,199 | 5,389 | 6,405 | 6,744 | 6,577 | 6,476 | 6,817 | 6,535 | 5,639 | 3,487 |
| 2000 | 1,049 | 2,117 | 1,165 | 675 | 932 | 884 | 1,416 | 2,316 | 2,017 | 1,673 | 2,165 | 2,414 |
| 2001 | 2,928 | 2,274 | 1,053 | 1,654 | 1,668 | 3,126 | 3,937 | 4,784 | 4,742 | 4,874 | 4,894 | 4,832 |
| 2002 | 4,574 | 3,896 | 2,833 | 3,021 | 2,837 | 3,435 | 3,778 | 4,122 | 3,856 | 3,693 | 2,995 | 3,023 |
| 2003 | 2,089 | 990 | 1,081 | 597 | 1,160 | 2,540 | 2,726 | 2,768 | 2,890 | 3,313 | 2,892 | 2,863 |
| 2004 | 1,990 | 1,904 | 1,570 | 985 | 1,611 | 2,801 | 3,769 | 4,903 | 5,368 | 4,824 | 4,815 | 4,982 |
| 2005 | 3,001 | 2,111 | 2,114 | 2,195 | 3,100 | 4,736 | 5,955 | 6,270 | 6,002 | 5,616 | 5,152 | 5,159 |
| 2006 | 5,590 | 4,814 | 4,284 | 3,883 | 4,145 | 5,351 | 5,844 | 5,667 | 5,938 | 5,619 | 5,298 | 4,944 |
| 2007 | 4,693 | 3,197 | 2,398 | 2,992 | 2,967 | 2,864 | 3,549 | 4,887 | 4,753 | 4,903 | 4,098 | 3,827 |
| 2008 | 2,857 | 1,748 | 1,664 | 1,064 | 1,489 | 1,849 | 2,478 | 3,240 | 3,612 | 2,910 | 3,405 | 3,866 |
| 2009 | 3,449 | 2,990 | 4,410 | 4,287 | 4,643 | 4,989 | 5,039 | 5,116 | 5,383 | 5,170 | 5,177 | 4,328 |
| 2010 | 4,887 | 4,538 | 3,632 | 3,764 | 3,198 | 3,887 | 4,488 | 4,549 | 5,041 | 4,910 | 4,487 | 3,730 |
| 2011 | 3,086 | 4,425 | 3,477 | 2,853 | 3,191 | 3,816 | 4,259 | 5,249 | 5,078 | 4,796 | 5,226 | 4,964 |
| 2012 | 3,867 | 3,954 | 3,066 | 2,599 | 2,655 | 2,489 | 2,780 | 2,913 | 3,435 | 3,615 | 2,311 | 1,706 |
| 2013 | 1,497 | 1,130 | 1,200 | 1,265 | 1,011 | 1,207 | 1,197 | 1,530 | 1,776 | 2,387 | 2,089 | 1,921 |
| 2014 | 1,314 | 1,128 | 1,184 | 798 | 1,002 | 1,584 | 2,012 | 2,064 | 2,066 | 2,649 | 2,390 | 2,508 |
| 2015 | 1,815 | 1,366 | 1,510 | 1,281 | 1,843 | 1,765 | 2,054 | 2,765 | 3,528 | 4,090 | 4,640 | 4,743 |
| 2016 | 4,530 | 4,100 | 3,672 | 4,080 | 4,040 | 4,547 | 5,564 | 5,671 | 5,685 | 5,711 | 5,781 | 5,400 |
| 2017 | 5,772 | 4,785 | 3,717 | 3,449 | 3,413 | 3,628 | 4,033 | 4,238 | 3,702 | 3,582 | 3,278 | 3,578 |
| 2018 | 2,828 | 2,616 | 2,235 | 1,463 | 1,148 | 1,378 | 1,617 | 1,900 | 3,429 | 3,379 | 2,800 | 3,082 |
| 2019 | 3,387 | 2,757 | 2,090 | 1,664 | 1,487 | 1,964 | 2,866 | 3,739 | 2,929 | 2,782 | 3,402 | 2,730 |
| 2020 | 2,473 | 2,098 | 2,315 | 3,470 | 5,309 | 5,562 | 5,914 | 5,662 | 5,345 | 5,688 | 5,433 | 5,218 |
| 2021 | 4,595 | 3,667 | 3,386 | 2,555 | 2,067 | 2,306 | 2,330 | 2,764 | 2,377 | 2,359 | 2,535 | 2,666 |
| 2022 | 1,496 | 1,990 | 1,385 | 773 | 793 | 758 | 866 | 770 | 799 | 1,117 | 1,297 | 1,134 |
| 2023 | 1,670 | 1,502 | 1,197 | 1,257 | 1,047 | 1,095 | 993 | 916 | 974 | 912 | 905 | 1,326 |
| 2024 | 1,494 | |||||||||||
| - = No Data Reported; -- = Not Applicable; NA = Not Available; W = Withheld to avoid disclosure of individual company data. |
| Release Date: 3/29/2024 |
| Next Release Date: 4/30/2024 |