|
Download Data (XLS File) |
|
||||||||
|
||||||||
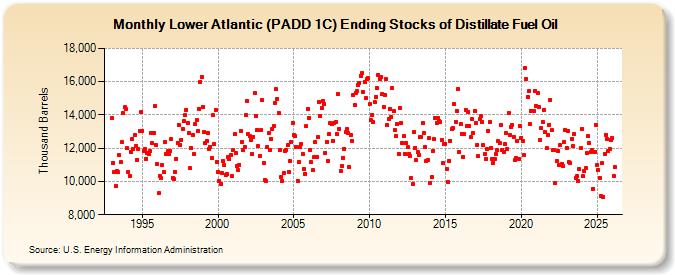
| Lower Atlantic (PADD 1C) Ending Stocks of Distillate Fuel Oil (Thousand Barrels) | ||||||||
| Year | Jan | Feb | Mar | Apr | May | Jun | Jul | Aug | Sep | Oct | Nov | Dec |
|---|---|---|---|---|---|---|---|---|---|---|---|---|
| 1993 | 13,816 | 11,115 | 10,573 | 9,711 | 10,604 | 10,547 | 11,573 | 11,146 | 12,347 | 14,098 | 14,460 | 14,347 |
| 1994 | 11,990 | 10,588 | 10,337 | 11,795 | 12,545 | 11,933 | 12,767 | 12,145 | 11,316 | 11,961 | 13,027 | 14,154 |
| 1995 | 13,058 | 11,841 | 11,977 | 11,366 | 11,716 | 11,634 | 11,813 | 12,907 | 12,282 | 12,907 | 14,526 | 12,200 |
| 1996 | 11,054 | 9,284 | 10,339 | 10,187 | 10,981 | 10,569 | 12,363 | 11,665 | 11,811 | 11,677 | 11,829 | 12,550 |
| 1997 | 10,180 | 10,141 | 10,579 | 11,374 | 12,333 | 13,409 | 12,218 | 12,520 | 13,165 | 13,622 | 13,987 | 14,296 |
| 1998 | 13,536 | 12,898 | 10,793 | 12,002 | 12,775 | 11,673 | 13,446 | 13,700 | 13,043 | 14,371 | 15,971 | 16,267 |
| 1999 | 14,478 | 12,988 | 12,296 | 12,419 | 12,940 | 11,933 | 12,090 | 11,401 | 13,967 | 12,263 | 14,297 | 11,184 |
| 2000 | 10,594 | 10,045 | 9,868 | 10,510 | 11,238 | 10,983 | 10,376 | 10,475 | 11,489 | 11,322 | 11,588 | 10,324 |
| 2001 | 11,888 | 12,823 | 11,719 | 10,909 | 10,686 | 11,005 | 13,040 | 12,387 | 11,881 | 12,069 | 13,994 | 14,834 |
| 2002 | 12,852 | 12,705 | 12,498 | 11,653 | 12,682 | 15,314 | 13,943 | 13,095 | 12,106 | 11,558 | 13,070 | 14,888 |
| 2003 | 11,128 | 10,096 | 10,017 | 12,069 | 12,905 | 11,906 | 12,560 | 13,125 | 13,323 | 14,719 | 15,530 | 14,978 |
| 2004 | 14,141 | 11,903 | 10,289 | 10,038 | 10,503 | 11,859 | 11,906 | 12,172 | 10,584 | 11,205 | 12,397 | 13,519 |
| 2005 | 12,777 | 12,733 | 12,101 | 10,045 | 11,182 | 12,071 | 12,279 | 11,638 | 10,771 | 10,468 | 13,318 | 14,362 |
| 2006 | 13,837 | 11,892 | 11,143 | 10,666 | 11,454 | 12,360 | 11,457 | 12,655 | 14,765 | 13,914 | 14,403 | 14,834 |
| 2007 | 14,655 | 11,705 | 12,384 | 11,252 | 12,832 | 13,489 | 13,456 | 12,461 | 13,538 | 13,560 | 12,849 | 15,283 |
| 2008 | 13,149 | 10,647 | 10,956 | 11,429 | 11,976 | 12,976 | 13,132 | 12,926 | 10,871 | 12,807 | 12,447 | 15,194 |
| 2009 | 14,587 | 15,327 | 15,410 | 15,792 | 15,949 | 16,361 | 16,525 | 15,390 | 16,009 | 15,037 | 16,134 | 16,205 |
| 2010 | 14,635 | 13,667 | 14,013 | 13,566 | 14,771 | 15,078 | 15,624 | 16,430 | 16,182 | 16,288 | 15,246 | 14,506 |
| 2011 | 15,197 | 16,138 | 13,389 | 13,747 | 14,357 | 13,886 | 15,604 | 14,220 | 13,076 | 12,708 | 13,450 | 11,654 |
| 2012 | 14,408 | 13,507 | 12,321 | 12,707 | 11,658 | 12,321 | 12,046 | 11,658 | 11,527 | 10,204 | 9,826 | 12,958 |
| 2013 | 12,025 | 11,273 | 11,763 | 11,593 | 12,660 | 12,664 | 13,490 | 12,939 | 12,067 | 11,237 | 11,314 | 12,585 |
| 2014 | 9,919 | 10,252 | 11,818 | 12,546 | 13,824 | 13,540 | 13,814 | 13,659 | 13,561 | 12,498 | 11,108 | 12,264 |
| 2015 | 12,259 | 10,771 | 9,994 | 11,243 | 12,456 | 13,166 | 13,201 | 14,664 | 13,592 | 14,256 | 15,571 | 11,771 |
| 2016 | 13,452 | 12,862 | 11,475 | 12,856 | 14,304 | 13,331 | 14,197 | 13,341 | 12,658 | 13,736 | 12,912 | 14,251 |
| 2017 | 13,519 | 12,195 | 11,513 | 13,727 | 13,911 | 13,598 | 12,174 | 11,625 | 11,374 | 11,926 | 13,025 | 13,591 |
| 2018 | 11,990 | 11,335 | 11,129 | 11,371 | 11,638 | 11,861 | 12,410 | 12,296 | 13,384 | 11,916 | 11,778 | 12,224 |
| 2019 | 12,909 | 11,949 | 14,108 | 12,771 | 13,303 | 13,423 | 12,697 | 11,262 | 11,420 | 12,440 | 11,378 | 13,319 |
| 2020 | 12,631 | 12,421 | 11,582 | 16,832 | 16,159 | 15,097 | 15,425 | 13,450 | 14,234 | 14,263 | 14,235 | 15,437 |
| 2021 | 14,522 | 15,336 | 14,469 | 12,498 | 13,200 | 13,581 | 14,305 | 12,973 | 11,999 | 12,807 | 13,411 | 14,907 |
| 2022 | 13,064 | 11,920 | 11,918 | 9,884 | 11,211 | 11,858 | 10,979 | 12,168 | 11,073 | 10,904 | 12,391 | 13,103 |
| 2023 | 12,029 | 12,992 | 11,266 | 11,073 | 12,576 | 12,179 | 12,833 | 10,217 | 10,304 | 10,056 | 10,724 | 11,990 |
| 2024 | 13,014 | |||||||||||
| - = No Data Reported; -- = Not Applicable; NA = Not Available; W = Withheld to avoid disclosure of individual company data. |
| Release Date: 3/29/2024 |
| Next Release Date: 4/30/2024 |