|
Download Data (XLS File) |
|
||||||||
|
||||||||
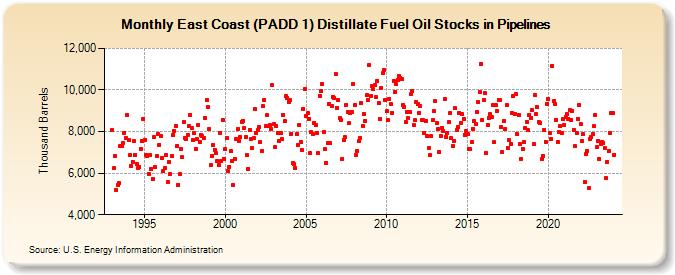
| East Coast (PADD 1) Distillate Fuel Oil Stocks in Pipelines (Thousand Barrels) | ||||||||
| Year | Jan | Feb | Mar | Apr | May | Jun | Jul | Aug | Sep | Oct | Nov | Dec |
|---|---|---|---|---|---|---|---|---|---|---|---|---|
| 1993 | 8,063 | 6,226 | 6,831 | 5,195 | 5,418 | 5,516 | 7,290 | 7,323 | 7,470 | 7,945 | 7,681 | 8,793 |
| 1994 | 7,570 | 6,874 | 6,354 | 6,552 | 7,525 | 6,895 | 6,433 | 6,266 | 6,291 | 7,176 | 7,524 | 8,594 |
| 1995 | 7,612 | 6,889 | 6,840 | 5,964 | 6,871 | 6,202 | 5,706 | 7,720 | 6,283 | 6,819 | 7,872 | 7,374 |
| 1996 | 7,805 | 6,747 | 6,092 | 6,233 | 6,870 | 5,567 | 6,528 | 5,955 | 6,824 | 7,847 | 8,021 | 8,270 |
| 1997 | 7,295 | 5,448 | 5,943 | 7,177 | 6,752 | 8,471 | 7,695 | 7,658 | 7,844 | 8,251 | 8,813 | 8,152 |
| 1998 | 7,617 | 7,908 | 7,170 | 7,647 | 8,304 | 7,502 | 7,835 | 7,775 | 7,687 | 8,659 | 9,499 | 9,160 |
| 1999 | 8,141 | 6,376 | 6,827 | 7,347 | 7,133 | 6,953 | 6,595 | 6,385 | 7,946 | 6,593 | 8,561 | 6,702 |
| 2000 | 7,154 | 7,674 | 6,106 | 6,311 | 7,052 | 6,583 | 5,426 | 6,685 | 7,625 | 8,112 | 7,543 | 7,748 |
| 2001 | 8,472 | 8,526 | 8,186 | 7,728 | 6,880 | 6,221 | 8,068 | 7,648 | 7,203 | 7,677 | 9,082 | 7,937 |
| 2002 | 8,072 | 8,231 | 7,509 | 7,056 | 9,205 | 9,506 | 8,273 | 8,793 | 8,284 | 8,306 | 8,138 | 10,226 |
| 2003 | 8,354 | 7,253 | 8,253 | 7,951 | 7,566 | 7,907 | 7,637 | 8,818 | 8,495 | 9,708 | 9,616 | 9,423 |
| 2004 | 9,499 | 7,897 | 6,465 | 6,439 | 6,245 | 7,878 | 7,375 | 8,326 | 7,499 | 7,089 | 9,096 | 10,044 |
| 2005 | 8,750 | 8,869 | 8,621 | 6,951 | 7,974 | 7,887 | 8,434 | 8,292 | 7,935 | 6,956 | 9,728 | 9,933 |
| 2006 | 10,291 | 7,971 | 7,140 | 6,510 | 7,432 | 9,343 | 7,437 | 9,225 | 9,680 | 9,619 | 10,785 | 9,150 |
| 2007 | 9,524 | 8,651 | 8,547 | 6,694 | 7,603 | 7,716 | 9,279 | 8,935 | 8,390 | 8,900 | 8,958 | 10,296 |
| 2008 | 9,255 | 6,857 | 7,072 | 7,525 | 7,694 | 9,356 | 8,287 | 8,858 | 8,511 | 9,737 | 9,524 | 11,218 |
| 2009 | 9,718 | 10,193 | 10,033 | 10,216 | 9,646 | 10,449 | 9,380 | 8,621 | 10,108 | 10,811 | 10,960 | 9,521 |
| 2010 | 8,968 | 8,545 | 9,581 | 9,311 | 8,900 | 10,432 | 9,918 | 10,292 | 10,496 | 10,661 | 10,588 | 10,506 |
| 2011 | 9,266 | 9,203 | 8,475 | 8,924 | 8,642 | 8,935 | 9,789 | 9,938 | 8,299 | 8,543 | 9,445 | 9,315 |
| 2012 | 8,906 | 9,205 | 8,551 | 8,549 | 7,929 | 8,494 | 7,766 | 7,195 | 6,868 | 7,765 | 8,560 | 8,982 |
| 2013 | 9,451 | 8,426 | 8,127 | 7,026 | 7,790 | 8,192 | 8,017 | 9,575 | 7,748 | 7,954 | 8,439 | 8,870 |
| 2014 | 7,668 | 7,308 | 7,551 | 9,117 | 8,057 | 8,230 | 8,904 | 8,431 | 8,834 | 8,620 | 7,857 | 8,011 |
| 2015 | 7,903 | 7,177 | 7,139 | 7,504 | 8,141 | 8,491 | 8,361 | 8,956 | 9,424 | 9,909 | 11,264 | 8,566 |
| 2016 | 9,522 | 9,842 | 6,979 | 8,318 | 8,662 | 8,836 | 8,679 | 9,288 | 7,484 | 9,280 | 9,000 | 9,519 |
| 2017 | 9,505 | 8,220 | 7,013 | 8,524 | 8,124 | 9,289 | 7,220 | 7,584 | 7,423 | 8,900 | 9,717 | 8,866 |
| 2018 | 9,783 | 7,865 | 8,794 | 7,411 | 6,698 | 7,164 | 7,477 | 8,181 | 8,463 | 8,061 | 8,820 | 8,661 |
| 2019 | 9,014 | 7,393 | 9,757 | 8,851 | 9,164 | 8,460 | 8,411 | 6,660 | 6,826 | 8,096 | 7,521 | 9,323 |
| 2020 | 9,564 | 7,950 | 7,665 | 11,171 | 9,452 | 9,335 | 8,574 | 7,504 | 7,974 | 8,245 | 7,920 | 8,599 |
| 2021 | 8,330 | 8,721 | 8,849 | 8,626 | 9,014 | 8,565 | 8,998 | 8,092 | 7,289 | 7,911 | 8,616 | 9,262 |
| 2022 | 8,342 | 7,542 | 7,870 | 5,585 | 6,918 | 7,070 | 5,265 | 7,639 | 7,747 | 7,871 | 8,253 | 8,819 |
| 2023 | 7,259 | 7,553 | 6,657 | 7,383 | 7,521 | 7,438 | 7,217 | 5,768 | 6,553 | 7,073 | 7,940 | 8,901 |
| 2024 | 8,878 | |||||||||||
| - = No Data Reported; -- = Not Applicable; NA = Not Available; W = Withheld to avoid disclosure of individual company data. |
| Release Date: 3/29/2024 |
| Next Release Date: 4/30/2024 |