|
Download Data (XLS File) |
|
||||||||
|
||||||||
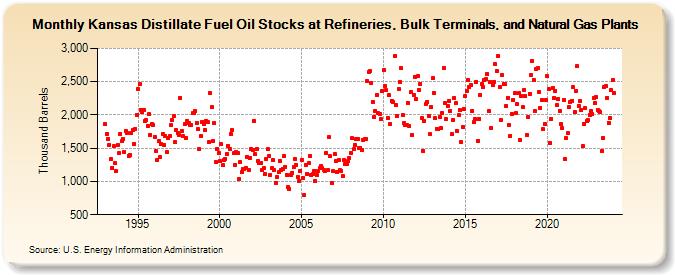
| Kansas Distillate Fuel Oil Stocks at Refineries, Bulk Terminals, and Natural Gas Plants (Thousand Barrels) | ||||||||
| Year | Jan | Feb | Mar | Apr | May | Jun | Jul | Aug | Sep | Oct | Nov | Dec |
|---|---|---|---|---|---|---|---|---|---|---|---|---|
| 1993 | 1,858 | 1,712 | 1,644 | 1,554 | 1,331 | 1,209 | 1,529 | 1,280 | 1,150 | 1,546 | 1,425 | 1,717 |
| 1994 | 1,601 | 1,631 | 1,445 | 1,760 | 1,735 | 1,387 | 1,404 | 1,724 | 1,776 | 1,570 | 1,790 | 2,001 |
| 1995 | 2,390 | 2,460 | 2,074 | 2,043 | 2,078 | 1,912 | 1,919 | 1,840 | 2,010 | 1,697 | 1,871 | 1,842 |
| 1996 | 1,671 | 1,451 | 1,329 | 1,607 | 1,360 | 1,562 | 1,717 | 1,553 | 1,682 | 1,442 | 1,659 | 1,679 |
| 1997 | 1,843 | 1,921 | 1,981 | 1,596 | 1,770 | 1,727 | 1,696 | 2,261 | 1,755 | 1,683 | 1,859 | 1,660 |
| 1998 | 1,915 | 1,886 | 1,855 | 1,845 | 2,022 | 2,031 | 2,054 | 1,884 | 1,781 | 1,483 | 1,683 | 1,897 |
| 1999 | 1,866 | 1,778 | 1,914 | 1,901 | 1,589 | 2,329 | 2,114 | 1,607 | 1,877 | 1,295 | 1,495 | 1,424 |
| 2000 | 1,305 | 1,561 | 1,242 | 1,329 | 1,343 | 1,415 | 1,540 | 1,494 | 1,707 | 1,771 | 1,422 | 1,251 |
| 2001 | 1,438 | 1,427 | 1,034 | 1,290 | 1,138 | 1,188 | 1,190 | 1,209 | 1,365 | 1,173 | 1,357 | 1,494 |
| 2002 | 1,469 | 1,911 | 1,408 | 1,485 | 1,305 | 1,282 | 1,277 | 1,166 | 1,199 | 1,105 | 1,334 | 1,487 |
| 2003 | 1,390 | 1,100 | 1,196 | 1,317 | 1,165 | 971 | 1,064 | 1,135 | 1,314 | 1,172 | 1,189 | 1,380 |
| 2004 | 1,223 | 1,096 | 913 | 893 | 1,101 | 1,132 | 1,212 | 1,339 | 1,247 | 1,072 | 1,013 | 1,161 |
| 2005 | 1,327 | 1,053 | 791 | 1,251 | 1,113 | 1,275 | 1,383 | 1,096 | 1,106 | 1,158 | 1,002 | 1,096 |
| 2006 | 1,161 | 1,198 | 1,227 | 1,200 | 1,179 | 1,162 | 1,432 | 1,166 | 1,662 | 1,378 | 976 | 1,151 |
| 2007 | 1,411 | 1,308 | 1,137 | 1,324 | 1,165 | 1,163 | 1,079 | 1,315 | 1,268 | 1,256 | 1,300 | 1,347 |
| 2008 | 1,432 | 1,649 | 1,483 | 1,554 | 1,641 | 1,635 | 1,498 | 1,500 | 1,475 | 1,625 | 1,634 | 1,642 |
| 2009 | 2,506 | 2,647 | 2,654 | 2,480 | 2,201 | 1,975 | 2,062 | 2,306 | 2,028 | 2,020 | 1,936 | 2,360 |
| 2010 | 2,676 | 2,435 | 2,369 | 1,957 | 2,292 | 1,859 | 2,213 | 2,191 | 2,882 | 2,144 | 1,982 | 2,386 |
| 2011 | 2,495 | 2,698 | 2,005 | 1,882 | 1,842 | 1,848 | 2,183 | 1,827 | 2,338 | 1,698 | 2,305 | 2,577 |
| 2012 | 2,233 | 2,578 | 2,379 | 2,467 | 1,954 | 1,461 | 1,908 | 2,165 | 2,199 | 1,985 | 1,708 | 2,113 |
| 2013 | 2,553 | 2,330 | 1,947 | 1,795 | 1,784 | 1,969 | 1,797 | 2,023 | 2,700 | 2,179 | 1,937 | 2,135 |
| 2014 | 2,216 | 2,059 | 1,708 | 1,927 | 2,258 | 2,174 | 1,759 | 1,992 | 2,070 | 1,586 | 1,821 | 2,084 |
| 2015 | 2,279 | 2,366 | 2,523 | 2,415 | 2,452 | 2,062 | 1,887 | 1,938 | 2,501 | 1,615 | 1,943 | 2,299 |
| 2016 | 2,468 | 2,413 | 2,528 | 2,540 | 2,619 | 2,057 | 2,502 | 1,804 | 2,447 | 2,502 | 2,758 | 2,658 |
| 2017 | 2,893 | 2,419 | 1,931 | 2,598 | 2,462 | 2,469 | 2,135 | 2,259 | 1,851 | 1,690 | 2,017 | 2,222 |
| 2018 | 2,326 | 2,023 | 2,159 | 2,322 | 1,628 | 2,287 | 2,118 | 2,375 | 2,277 | 1,702 | 1,965 | 2,319 |
| 2019 | 2,606 | 2,813 | 2,526 | 2,061 | 2,684 | 2,700 | 2,345 | 2,106 | 2,224 | 1,782 | 1,866 | 2,229 |
| 2020 | 2,578 | 2,389 | 1,578 | 1,942 | 2,408 | 2,260 | 2,365 | 2,147 | 2,236 | 2,059 | 1,862 | 1,802 |
| 2021 | 2,225 | 1,332 | 1,648 | 1,722 | 2,119 | 2,197 | 2,214 | 2,414 | 2,041 | 2,365 | 2,729 | 2,137 |
| 2022 | 2,206 | 2,080 | 1,526 | 1,868 | 2,099 | 1,910 | 1,921 | 2,000 | 2,062 | 2,007 | 2,256 | 2,180 |
| 2023 | 2,267 | 2,075 | 2,053 | 2,047 | 1,463 | 1,656 | 2,415 | 2,434 | 2,260 | 1,881 | 1,956 | 2,369 |
| 2024 | 2,524 | |||||||||||
| - = No Data Reported; -- = Not Applicable; NA = Not Available; W = Withheld to avoid disclosure of individual company data. |
| Release Date: 3/29/2024 |
| Next Release Date: 4/30/2024 |