|
Download Data (XLS File) |
|
||||||||
|
||||||||
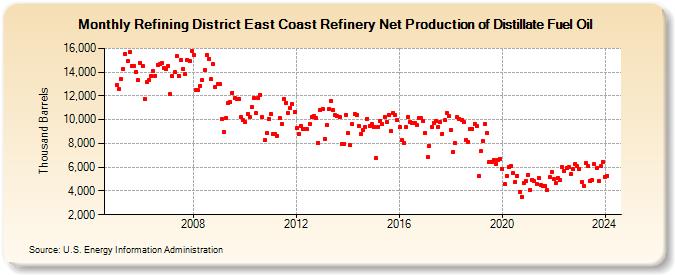
| Refining District East Coast Refinery Net Production of Distillate Fuel Oil (Thousand Barrels) | ||||||||
| Year | Jan | Feb | Mar | Apr | May | Jun | Jul | Aug | Sep | Oct | Nov | Dec |
|---|---|---|---|---|---|---|---|---|---|---|---|---|
| 2005 | 12,913 | 12,575 | 13,444 | 14,280 | 15,523 | 14,948 | 15,683 | 14,540 | 14,512 | 14,049 | 13,330 | 14,808 |
| 2006 | 14,555 | 11,750 | 13,152 | 13,326 | 13,699 | 14,071 | 13,711 | 14,630 | 14,702 | 14,750 | 14,344 | 14,290 |
| 2007 | 14,528 | 12,123 | 13,641 | 13,974 | 15,326 | 13,690 | 14,985 | 14,302 | 13,857 | 15,040 | 14,907 | 15,767 |
| 2008 | 15,448 | 12,523 | 12,490 | 12,874 | 13,357 | 14,153 | 15,440 | 15,128 | 13,397 | 14,658 | 12,739 | 12,973 |
| 2009 | 12,988 | 10,044 | 8,970 | 10,148 | 11,366 | 11,459 | 12,274 | 11,844 | 11,738 | 11,719 | 10,248 | 9,953 |
| 2010 | 9,800 | 10,514 | 10,264 | 11,037 | 11,804 | 10,543 | 11,799 | 12,100 | 10,195 | 8,263 | 8,858 | 10,053 |
| 2011 | 10,503 | 8,778 | 8,785 | 8,660 | 10,179 | 9,669 | 11,766 | 11,438 | 10,580 | 10,996 | 11,315 | 10,630 |
| 2012 | 9,280 | 8,818 | 9,479 | 9,233 | 9,180 | 9,198 | 9,671 | 10,258 | 10,312 | 10,129 | 8,059 | 10,843 |
| 2013 | 10,912 | 8,394 | 9,525 | 10,898 | 11,612 | 10,776 | 10,354 | 10,268 | 10,192 | 7,987 | 7,974 | 10,427 |
| 2014 | 8,875 | 7,830 | 9,626 | 10,462 | 10,420 | 9,472 | 8,836 | 9,158 | 9,425 | 10,097 | 9,491 | 9,619 |
| 2015 | 9,405 | 6,753 | 9,425 | 9,903 | 9,600 | 10,237 | 9,805 | 10,431 | 9,045 | 10,572 | 10,372 | 9,940 |
| 2016 | 9,345 | 8,270 | 8,025 | 9,379 | 10,247 | 9,838 | 9,713 | 9,720 | 9,525 | 10,167 | 10,110 | 9,901 |
| 2017 | 8,861 | 6,847 | 7,797 | 9,408 | 9,727 | 9,928 | 9,405 | 9,794 | 8,836 | 9,933 | 10,594 | 10,270 |
| 2018 | 9,128 | 7,290 | 8,023 | 10,187 | 10,088 | 9,983 | 9,777 | 8,301 | 8,130 | 9,178 | 9,224 | 9,673 |
| 2019 | 9,427 | 5,239 | 7,331 | 8,215 | 9,665 | 8,877 | 6,442 | 6,422 | 6,636 | 6,289 | 6,596 | 6,724 |
| 2020 | 5,874 | 4,564 | 5,240 | 6,000 | 6,123 | 5,527 | 4,761 | 5,293 | 3,918 | 3,515 | 4,669 | 4,809 |
| 2021 | 5,359 | 4,101 | 4,955 | 4,800 | 4,591 | 5,099 | 4,492 | 4,454 | 4,379 | 4,041 | 5,144 | 5,614 |
| 2022 | 4,972 | 4,630 | 5,121 | 4,906 | 6,012 | 5,681 | 5,934 | 5,995 | 5,424 | 5,845 | 6,307 | 6,060 |
| 2023 | 5,872 | 4,791 | 4,438 | 6,375 | 6,081 | 4,844 | 4,904 | 6,239 | 5,892 | 4,832 | 6,097 | 6,441 |
| 2024 | 5,211 | |||||||||||
| - = No Data Reported; -- = Not Applicable; NA = Not Available; W = Withheld to avoid disclosure of individual company data. |
| Release Date: 3/29/2024 |
| Next Release Date: 4/30/2024 |