|
Download Data (XLS File) |
|
||||||||
|
||||||||
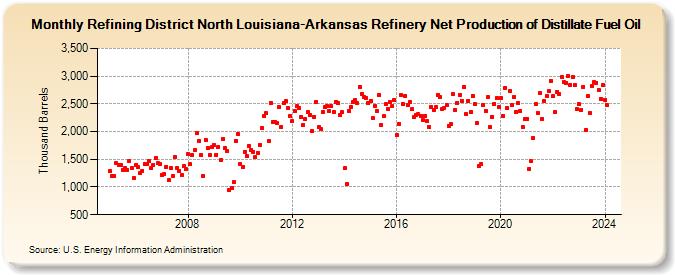
| Refining District North Louisiana-Arkansas Refinery Net Production of Distillate Fuel Oil (Thousand Barrels) | ||||||||
| Year | Jan | Feb | Mar | Apr | May | Jun | Jul | Aug | Sep | Oct | Nov | Dec |
|---|---|---|---|---|---|---|---|---|---|---|---|---|
| 2005 | 1,282 | 1,190 | 1,194 | 1,424 | 1,389 | 1,388 | 1,312 | 1,346 | 1,315 | 1,473 | 1,342 | 1,170 |
| 2006 | 1,399 | 1,352 | 1,249 | 1,296 | 1,411 | 1,419 | 1,466 | 1,336 | 1,403 | 1,522 | 1,424 | 1,410 |
| 2007 | 1,224 | 1,228 | 1,369 | 1,118 | 1,340 | 1,195 | 1,544 | 1,348 | 1,290 | 1,208 | 1,378 | 1,324 |
| 2008 | 1,597 | 1,408 | 1,576 | 1,659 | 1,966 | 1,835 | 1,576 | 1,200 | 1,849 | 1,701 | 1,581 | 1,714 |
| 2009 | 1,761 | 1,584 | 1,726 | 1,484 | 1,872 | 1,695 | 1,641 | 951 | 988 | 1,090 | 1,838 | 1,954 |
| 2010 | 1,417 | 1,358 | 1,636 | 1,561 | 1,741 | 1,662 | 1,637 | 1,534 | 1,618 | 1,766 | 2,065 | 2,276 |
| 2011 | 2,329 | 1,826 | 2,513 | 2,176 | 2,174 | 2,149 | 2,440 | 2,083 | 2,511 | 2,549 | 2,427 | 2,283 |
| 2012 | 2,185 | 2,368 | 2,454 | 2,424 | 2,270 | 2,124 | 2,229 | 2,351 | 2,295 | 2,011 | 2,271 | 2,532 |
| 2013 | 2,081 | 2,041 | 2,360 | 2,441 | 2,453 | 2,367 | 2,459 | 2,353 | 2,539 | 2,511 | 2,296 | 2,347 |
| 2014 | 1,336 | 1,049 | 2,373 | 2,447 | 2,532 | 2,577 | 2,507 | 2,810 | 2,681 | 2,632 | 2,602 | 2,510 |
| 2015 | 2,560 | 2,246 | 2,463 | 2,373 | 2,661 | 2,124 | 2,272 | 2,489 | 2,413 | 2,525 | 2,458 | 2,568 |
| 2016 | 1,946 | 2,142 | 2,660 | 2,495 | 2,643 | 2,482 | 2,537 | 2,400 | 2,265 | 2,307 | 2,311 | 2,284 |
| 2017 | 2,210 | 2,286 | 2,186 | 2,076 | 2,440 | 2,389 | 2,438 | 2,667 | 2,625 | 2,400 | 2,426 | 2,482 |
| 2018 | 2,105 | 2,128 | 2,672 | 2,393 | 2,520 | 2,667 | 2,559 | 2,806 | 2,314 | 2,552 | 2,350 | 2,645 |
| 2019 | 2,494 | 2,160 | 1,383 | 1,412 | 2,479 | 2,379 | 2,626 | 2,084 | 2,270 | 2,502 | 2,601 | 2,451 |
| 2020 | 2,608 | 2,277 | 2,794 | 2,433 | 2,732 | 2,471 | 2,628 | 2,352 | 2,509 | 2,370 | 2,090 | 2,225 |
| 2021 | 2,233 | 1,333 | 1,461 | 1,886 | 2,491 | 2,335 | 2,690 | 2,234 | 2,549 | 2,640 | 2,730 | 2,920 |
| 2022 | 2,636 | 2,351 | 2,719 | 2,673 | 2,990 | 2,894 | 2,884 | 3,004 | 2,845 | 2,977 | 2,833 | 2,401 |
| 2023 | 2,488 | 2,388 | 2,812 | 2,025 | 2,646 | 2,335 | 2,827 | 2,887 | 2,901 | 2,816 | 2,573 | 2,902 |
| 2024 | 2,565 | 2,471 | 2,460 | 2,374 | 2,823 | 2,300 | ||||||
| - = No Data Reported; -- = Not Applicable; NA = Not Available; W = Withheld to avoid disclosure of individual company data. |
| Release Date: 8/30/2024 |
| Next Release Date: 9/30/2024 |