|
Download Data (XLS File) |
|
||||||||
|
||||||||
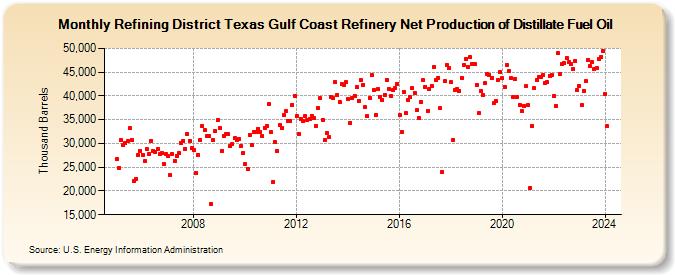
| Refining District Texas Gulf Coast Refinery Net Production of Distillate Fuel Oil (Thousand Barrels) | ||||||||
| Year | Jan | Feb | Mar | Apr | May | Jun | Jul | Aug | Sep | Oct | Nov | Dec |
|---|---|---|---|---|---|---|---|---|---|---|---|---|
| 2005 | 26,663 | 24,835 | 30,714 | 29,711 | 30,048 | 30,416 | 33,212 | 30,816 | 22,191 | 22,539 | 27,553 | 28,473 |
| 2006 | 27,629 | 26,299 | 28,761 | 27,830 | 30,599 | 28,438 | 28,235 | 28,750 | 27,736 | 28,009 | 25,624 | 27,754 |
| 2007 | 27,271 | 23,404 | 27,761 | 26,346 | 27,405 | 27,890 | 30,024 | 30,600 | 28,893 | 32,064 | 30,617 | 29,007 |
| 2008 | 28,584 | 23,842 | 27,622 | 30,693 | 33,623 | 32,768 | 31,588 | 31,628 | 17,273 | 30,699 | 32,652 | 34,945 |
| 2009 | 33,230 | 28,477 | 31,619 | 31,888 | 31,909 | 29,400 | 29,872 | 31,084 | 30,681 | 31,003 | 29,427 | 27,974 |
| 2010 | 25,635 | 24,626 | 31,867 | 29,664 | 32,374 | 32,326 | 33,129 | 32,454 | 31,602 | 33,322 | 33,772 | 38,237 |
| 2011 | 32,314 | 21,912 | 30,260 | 28,506 | 33,925 | 33,334 | 35,981 | 36,731 | 34,784 | 34,791 | 38,115 | 40,039 |
| 2012 | 35,801 | 32,073 | 35,124 | 34,673 | 35,749 | 34,936 | 35,158 | 35,856 | 35,398 | 33,625 | 37,406 | 39,519 |
| 2013 | 34,986 | 30,708 | 32,134 | 31,289 | 39,849 | 39,536 | 42,956 | 40,140 | 38,824 | 42,564 | 42,372 | 42,877 |
| 2014 | 39,267 | 34,360 | 39,626 | 39,995 | 41,788 | 38,984 | 43,307 | 42,384 | 37,574 | 35,745 | 39,556 | 44,400 |
| 2015 | 41,286 | 35,958 | 41,474 | 39,824 | 39,096 | 40,258 | 43,393 | 41,455 | 40,029 | 41,258 | 41,708 | 42,608 |
| 2016 | 35,916 | 32,508 | 40,900 | 36,302 | 39,129 | 39,766 | 41,623 | 40,669 | 36,987 | 35,364 | 38,750 | 43,259 |
| 2017 | 41,945 | 36,887 | 41,497 | 42,121 | 46,092 | 43,369 | 43,864 | 37,389 | 24,074 | 43,036 | 46,512 | 45,836 |
| 2018 | 42,823 | 30,787 | 41,316 | 41,537 | 41,135 | 43,828 | 46,510 | 47,829 | 46,017 | 48,131 | 46,751 | 46,802 |
| 2019 | 42,356 | 36,362 | 40,996 | 40,223 | 42,639 | 44,712 | 44,371 | 43,728 | 38,428 | 38,888 | 43,329 | 45,027 |
| 2020 | 43,680 | 41,914 | 46,514 | 45,215 | 43,871 | 39,758 | 43,603 | 39,789 | 38,089 | 36,815 | 37,885 | 41,986 |
| 2021 | 38,052 | 20,637 | 33,659 | 41,644 | 43,321 | 43,986 | 43,875 | 44,417 | 42,705 | 42,919 | 44,150 | 44,379 |
| 2022 | 40,031 | 37,946 | 49,000 | 44,634 | 46,765 | 46,831 | 48,001 | 47,093 | 46,737 | 45,759 | 47,393 | 41,141 |
| 2023 | 42,028 | 37,992 | 41,000 | 42,841 | 47,164 | 45,874 | 46,652 | 45,127 | 45,267 | 47,389 | 47,849 | 49,510 |
| 2024 | 40,366 | 33,580 | 45,976 | 44,076 | 45,319 | 45,170 | ||||||
| - = No Data Reported; -- = Not Applicable; NA = Not Available; W = Withheld to avoid disclosure of individual company data. |
| Release Date: 8/30/2024 |
| Next Release Date: 9/30/2024 |