|
Download Data (XLS File) |
|
||||||||
|
||||||||
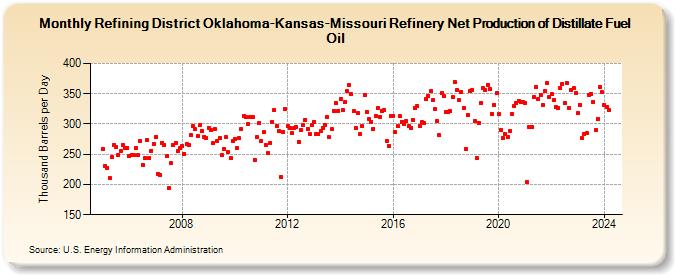
| Refining District Oklahoma-Kansas-Missouri Refinery Net Production of Distillate Fuel Oil (Thousand Barrels per Day) | ||||||||
| Year | Jan | Feb | Mar | Apr | May | Jun | Jul | Aug | Sep | Oct | Nov | Dec |
|---|---|---|---|---|---|---|---|---|---|---|---|---|
| 2005 | 258 | 231 | 228 | 210 | 245 | 266 | 262 | 249 | 255 | 266 | 261 | 260 |
| 2006 | 247 | 249 | 249 | 261 | 248 | 272 | 233 | 243 | 274 | 244 | 256 | 267 |
| 2007 | 279 | 218 | 216 | 269 | 266 | 247 | 194 | 235 | 266 | 269 | 255 | 260 |
| 2008 | 264 | 251 | 267 | 265 | 281 | 296 | 291 | 280 | 299 | 289 | 279 | 277 |
| 2009 | 294 | 290 | 268 | 291 | 272 | 276 | 249 | 259 | 278 | 253 | 244 | 272 |
| 2010 | 275 | 260 | 276 | 291 | 314 | 311 | 300 | 312 | 311 | 241 | 278 | 302 |
| 2011 | 272 | 286 | 266 | 252 | 269 | 304 | 323 | 297 | 289 | 213 | 287 | 324 |
| 2012 | 296 | 294 | 285 | 293 | 295 | 271 | 290 | 299 | 307 | 292 | 284 | 298 |
| 2013 | 304 | 283 | 283 | 288 | 294 | 298 | 311 | 278 | 291 | 322 | 334 | 322 |
| 2014 | 341 | 323 | 336 | 354 | 364 | 349 | 321 | 293 | 318 | 283 | 296 | 348 |
| 2015 | 320 | 308 | 304 | 292 | 314 | 326 | 312 | 322 | 323 | 272 | 264 | 313 |
| 2016 | 313 | 287 | 296 | 313 | 304 | 300 | 305 | 296 | 294 | 307 | 326 | 329 |
| 2017 | 297 | 303 | 301 | 342 | 347 | 354 | 339 | 324 | 305 | 281 | 351 | 346 |
| 2018 | 320 | 319 | 321 | 344 | 369 | 356 | 339 | 353 | 326 | 259 | 315 | 354 |
| 2019 | 356 | 305 | 244 | 302 | 335 | 359 | 356 | 365 | 357 | 317 | 332 | 351 |
| 2020 | 316 | 290 | 277 | 284 | 279 | 289 | 317 | 329 | 334 | 338 | 336 | 337 |
| 2021 | 334 | 204 | 295 | 295 | 345 | 361 | 341 | 348 | 332 | 354 | 368 | 344 |
| 2022 | 349 | 340 | 328 | 327 | 360 | 366 | 334 | 368 | 326 | 356 | 359 | 351 |
| 2023 | 318 | 332 | 276 | 283 | 285 | 348 | 350 | 336 | 290 | 309 | 361 | 353 |
| 2024 | 332 | 328 | ||||||||||
| - = No Data Reported; -- = Not Applicable; NA = Not Available; W = Withheld to avoid disclosure of individual company data. |
| Release Date: 4/30/2024 |
| Next Release Date: 5/31/2024 |