|
Download Data (XLS File) |
|
||||||||
|
||||||||
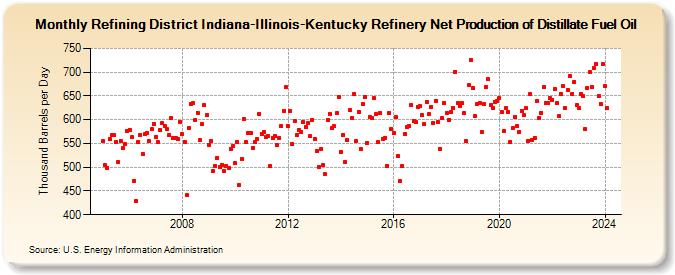
| Refining District Indiana-Illinois-Kentucky Refinery Net Production of Distillate Fuel Oil (Thousand Barrels per Day) | ||||||||
| Year | Jan | Feb | Mar | Apr | May | Jun | Jul | Aug | Sep | Oct | Nov | Dec |
|---|---|---|---|---|---|---|---|---|---|---|---|---|
| 2005 | 555 | 504 | 499 | 560 | 567 | 567 | 553 | 511 | 556 | 540 | 548 | 576 |
| 2006 | 579 | 563 | 471 | 429 | 553 | 568 | 528 | 569 | 572 | 555 | 580 | 591 |
| 2007 | 564 | 552 | 578 | 592 | 586 | 580 | 567 | 604 | 561 | 561 | 559 | 596 |
| 2008 | 569 | 554 | 441 | 583 | 634 | 635 | 600 | 615 | 557 | 590 | 630 | 609 |
| 2009 | 547 | 556 | 492 | 503 | 520 | 500 | 505 | 491 | 502 | 499 | 539 | 545 |
| 2010 | 509 | 553 | 462 | 518 | 601 | 553 | 573 | 572 | 541 | 552 | 559 | 612 |
| 2011 | 570 | 574 | 563 | 566 | 502 | 562 | 565 | 546 | 562 | 586 | 619 | 668 |
| 2012 | 586 | 618 | 549 | 598 | 567 | 579 | 575 | 595 | 585 | 592 | 565 | 600 |
| 2013 | 560 | 534 | 501 | 538 | 505 | 486 | 600 | 612 | 582 | 586 | 614 | 648 |
| 2014 | 532 | 568 | 511 | 557 | 620 | 603 | 653 | 555 | 617 | 538 | 633 | 648 |
| 2015 | 551 | 606 | 604 | 646 | 611 | 553 | 614 | 560 | 562 | 503 | 614 | 581 |
| 2016 | 572 | 606 | 524 | 470 | 503 | 570 | 584 | 587 | 630 | 597 | 596 | 627 |
| 2017 | 628 | 609 | 591 | 638 | 611 | 627 | 593 | 640 | 595 | 539 | 603 | 635 |
| 2018 | 615 | 600 | 617 | 624 | 701 | 636 | 628 | 635 | 613 | 555 | 672 | 726 |
| 2019 | 666 | 607 | 633 | 635 | 575 | 632 | 668 | 685 | 630 | 625 | 638 | 640 |
| 2020 | 645 | 616 | 577 | 625 | 617 | 554 | 582 | 606 | 587 | 575 | 619 | 609 |
| 2021 | 624 | 556 | 653 | 558 | 562 | 639 | 604 | 615 | 668 | 635 | 635 | 645 |
| 2022 | 642 | 664 | 635 | 607 | 654 | 670 | 625 | 663 | 692 | 655 | 680 | 630 |
| 2023 | 624 | 655 | 649 | 580 | 667 | 700 | 668 | 708 | 717 | 650 | 634 | 717 |
| 2024 | 670 | |||||||||||
| - = No Data Reported; -- = Not Applicable; NA = Not Available; W = Withheld to avoid disclosure of individual company data. |
| Release Date: 3/29/2024 |
| Next Release Date: 4/30/2024 |