|
Download Data (XLS File) |
|
||||||||
|
||||||||
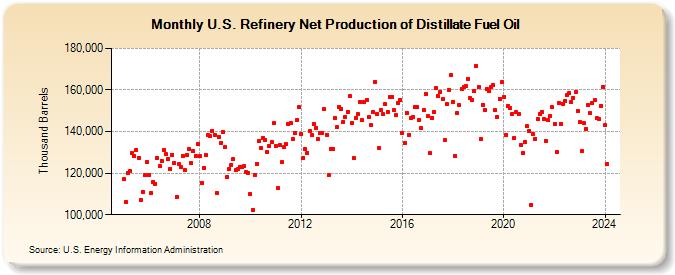
| U.S. Refinery Net Production of Distillate Fuel Oil (Thousand Barrels) | ||||||||
| Year | Jan | Feb | Mar | Apr | May | Jun | Jul | Aug | Sep | Oct | Nov | Dec |
|---|---|---|---|---|---|---|---|---|---|---|---|---|
| 2005 | 117,090 | 106,324 | 120,087 | 120,841 | 129,555 | 128,228 | 131,329 | 127,347 | 107,098 | 111,120 | 118,978 | 125,351 |
| 2006 | 119,046 | 110,345 | 115,813 | 114,980 | 127,248 | 123,223 | 126,011 | 131,251 | 129,004 | 126,804 | 122,094 | 128,922 |
| 2007 | 124,828 | 108,733 | 124,273 | 123,066 | 128,410 | 121,486 | 128,505 | 131,569 | 124,744 | 130,449 | 128,347 | 134,120 |
| 2008 | 128,024 | 115,412 | 122,532 | 128,623 | 138,232 | 137,624 | 140,218 | 138,433 | 110,444 | 137,489 | 134,659 | 139,849 |
| 2009 | 132,593 | 118,317 | 122,024 | 124,090 | 126,668 | 121,269 | 121,830 | 122,890 | 122,788 | 123,285 | 120,400 | 120,264 |
| 2010 | 109,886 | 102,310 | 118,886 | 124,593 | 135,308 | 132,026 | 136,909 | 135,941 | 130,056 | 133,170 | 134,802 | 144,063 |
| 2011 | 133,140 | 112,613 | 133,522 | 125,177 | 132,338 | 133,800 | 143,809 | 144,015 | 136,521 | 139,241 | 145,734 | 151,782 |
| 2012 | 138,699 | 127,250 | 131,595 | 129,871 | 140,222 | 138,252 | 143,537 | 141,703 | 136,269 | 139,065 | 139,346 | 150,662 |
| 2013 | 138,430 | 118,883 | 131,797 | 131,434 | 146,757 | 141,977 | 151,594 | 150,839 | 144,749 | 147,201 | 149,621 | 156,939 |
| 2014 | 143,897 | 127,176 | 146,759 | 148,215 | 154,436 | 145,555 | 154,270 | 154,992 | 146,823 | 143,133 | 149,172 | 163,891 |
| 2015 | 148,604 | 131,877 | 150,370 | 148,252 | 153,076 | 149,637 | 156,611 | 156,858 | 150,151 | 147,910 | 153,793 | 155,259 |
| 2016 | 139,350 | 134,301 | 149,066 | 138,516 | 146,293 | 147,174 | 151,695 | 151,653 | 145,579 | 141,483 | 150,313 | 158,295 |
| 2017 | 147,311 | 129,612 | 146,671 | 149,591 | 160,719 | 156,891 | 159,031 | 155,653 | 135,796 | 153,159 | 160,145 | 167,229 |
| 2018 | 154,407 | 128,123 | 148,724 | 152,540 | 160,488 | 161,435 | 161,935 | 165,418 | 156,116 | 155,111 | 159,600 | 171,453 |
| 2019 | 161,668 | 136,278 | 152,985 | 150,566 | 160,409 | 159,628 | 161,602 | 162,375 | 150,141 | 147,198 | 155,571 | 163,648 |
| 2020 | 156,531 | 138,369 | 152,264 | 151,390 | 148,474 | 136,810 | 149,217 | 148,591 | 133,756 | 129,643 | 134,879 | 142,533 |
| 2021 | 140,311 | 104,867 | 138,994 | 136,647 | 146,020 | 148,391 | 149,543 | 145,988 | 135,530 | 145,424 | 147,422 | 151,593 |
| 2022 | 143,559 | 130,044 | 153,854 | 143,814 | 153,463 | 154,769 | 157,800 | 158,308 | 154,403 | 156,362 | 159,099 | 149,927 |
| 2023 | 144,616 | 130,426 | 143,897 | 141,464 | 152,665 | 148,756 | 153,775 | 154,959 | 146,526 | 146,059 | 152,468 | 161,499 |
| 2024 | 142,983 | |||||||||||
| - = No Data Reported; -- = Not Applicable; NA = Not Available; W = Withheld to avoid disclosure of individual company data. |
| Release Date: 3/29/2024 |
| Next Release Date: 4/30/2024 |