|
Download Data (XLS File) |
|
||||||||
|
||||||||
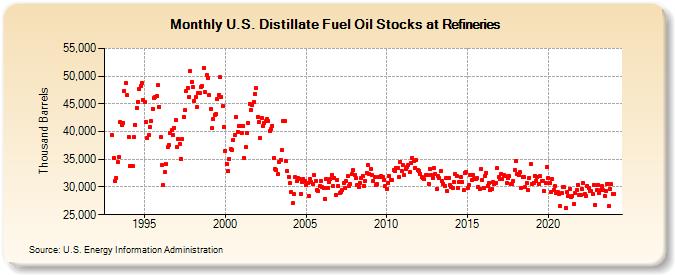
| U.S. Distillate Fuel Oil Stocks at Refineries (Thousand Barrels) | ||||||||
| Year | Jan | Feb | Mar | Apr | May | Jun | Jul | Aug | Sep | Oct | Nov | Dec |
|---|---|---|---|---|---|---|---|---|---|---|---|---|
| 1993 | 39,288 | 35,182 | 31,067 | 31,658 | 34,419 | 35,362 | 41,692 | 41,225 | 41,620 | 47,404 | 48,797 | 46,531 |
| 1994 | 39,028 | 33,862 | 33,795 | 33,834 | 38,969 | 41,260 | 44,297 | 45,399 | 47,667 | 48,210 | 48,763 | 45,756 |
| 1995 | 45,370 | 41,727 | 38,757 | 39,334 | 40,759 | 41,889 | 44,157 | 46,027 | 46,322 | 46,391 | 48,342 | 44,460 |
| 1996 | 39,008 | 34,023 | 30,342 | 32,624 | 34,160 | 37,137 | 37,631 | 39,703 | 40,228 | 39,332 | 40,707 | 41,998 |
| 1997 | 37,175 | 38,653 | 37,773 | 35,126 | 38,649 | 42,709 | 43,810 | 47,227 | 47,906 | 46,181 | 50,858 | 48,997 |
| 1998 | 47,953 | 45,519 | 46,175 | 44,440 | 47,025 | 46,951 | 48,093 | 48,185 | 51,464 | 47,078 | 50,231 | 49,728 |
| 1999 | 46,579 | 44,081 | 40,579 | 42,180 | 43,031 | 43,197 | 45,820 | 46,618 | 49,753 | 46,213 | 44,556 | 40,872 |
| 2000 | 36,520 | 34,187 | 32,897 | 34,960 | 36,882 | 36,730 | 38,557 | 39,326 | 42,669 | 39,986 | 40,958 | 41,060 |
| 2001 | 39,757 | 40,999 | 35,204 | 37,146 | 39,680 | 41,502 | 45,024 | 43,935 | 44,779 | 45,331 | 46,797 | 47,797 |
| 2002 | 42,693 | 41,733 | 38,919 | 42,479 | 41,081 | 41,510 | 41,897 | 42,237 | 41,863 | 40,056 | 40,371 | 41,080 |
| 2003 | 35,239 | 33,244 | 33,081 | 32,268 | 34,442 | 34,936 | 36,629 | 41,920 | 41,820 | 34,732 | 32,817 | 31,850 |
| 2004 | 30,693 | 29,018 | 27,038 | 28,669 | 31,768 | 31,080 | 31,564 | 31,511 | 28,788 | 30,943 | 31,463 | 31,147 |
| 2005 | 30,321 | 30,727 | 28,452 | 31,397 | 30,956 | 30,606 | 32,206 | 31,085 | 29,432 | 29,306 | 30,153 | 31,129 |
| 2006 | 29,929 | 29,850 | 27,924 | 31,412 | 29,807 | 30,862 | 31,440 | 32,243 | 30,216 | 31,698 | 28,550 | 31,318 |
| 2007 | 30,179 | 28,938 | 29,146 | 29,471 | 30,752 | 29,844 | 31,045 | 31,950 | 30,206 | 30,485 | 32,337 | 33,001 |
| 2008 | 32,109 | 31,594 | 30,410 | 29,945 | 30,795 | 31,639 | 32,004 | 30,201 | 31,088 | 32,604 | 33,925 | 32,349 |
| 2009 | 33,330 | 32,125 | 31,106 | 31,870 | 30,437 | 30,491 | 31,882 | 31,888 | 31,944 | 31,729 | 31,330 | 30,239 |
| 2010 | 29,650 | 30,723 | 31,995 | 31,292 | 31,189 | 33,083 | 32,967 | 33,474 | 33,477 | 31,838 | 34,574 | 32,948 |
| 2011 | 33,947 | 32,157 | 33,313 | 33,524 | 33,983 | 32,615 | 34,253 | 35,304 | 34,738 | 33,496 | 34,788 | 33,037 |
| 2012 | 32,899 | 32,356 | 31,755 | 31,663 | 31,373 | 32,172 | 32,130 | 30,598 | 33,301 | 32,087 | 31,661 | 33,466 |
| 2013 | 32,304 | 29,619 | 32,030 | 31,551 | 32,823 | 31,145 | 30,612 | 30,105 | 31,567 | 29,210 | 31,684 | 30,310 |
| 2014 | 30,005 | 29,848 | 30,971 | 32,323 | 31,998 | 29,808 | 30,971 | 31,802 | 30,877 | 29,375 | 32,520 | 32,673 |
| 2015 | 29,890 | 30,341 | 32,132 | 31,283 | 32,236 | 31,434 | 31,426 | 31,591 | 29,955 | 29,649 | 33,315 | 31,285 |
| 2016 | 29,832 | 32,006 | 32,571 | 30,262 | 30,793 | 29,443 | 29,572 | 30,853 | 30,452 | 30,787 | 33,421 | 31,847 |
| 2017 | 31,400 | 32,411 | 31,482 | 32,150 | 31,967 | 30,719 | 31,535 | 32,023 | 30,493 | 30,592 | 31,023 | 33,068 |
| 2018 | 34,762 | 32,257 | 32,123 | 32,634 | 29,882 | 31,818 | 31,780 | 29,964 | 30,755 | 29,441 | 31,688 | 34,117 |
| 2019 | 30,592 | 30,782 | 32,053 | 31,167 | 31,791 | 30,549 | 31,969 | 31,068 | 31,043 | 29,262 | 30,794 | 33,564 |
| 2020 | 31,577 | 30,747 | 29,080 | 31,365 | 29,504 | 30,114 | 28,947 | 29,130 | 28,816 | 26,488 | 28,894 | 29,917 |
| 2021 | 29,929 | 26,226 | 29,018 | 28,336 | 29,683 | 28,285 | 28,365 | 26,986 | 28,963 | 29,372 | 30,427 | 28,572 |
| 2022 | 28,557 | 29,625 | 30,750 | 28,745 | 28,410 | 30,241 | 29,760 | 29,342 | 29,212 | 28,748 | 30,445 | 26,834 |
| 2023 | 29,371 | 30,417 | 28,874 | 29,432 | 30,091 | 29,438 | 28,407 | 29,334 | 30,630 | 26,569 | 29,709 | 30,494 |
| 2024 | 28,746 | |||||||||||
| - = No Data Reported; -- = Not Applicable; NA = Not Available; W = Withheld to avoid disclosure of individual company data. |
| Release Date: 3/29/2024 |
| Next Release Date: 4/30/2024 |