|
Download Data (XLS File) |
|
||||||||
|
||||||||
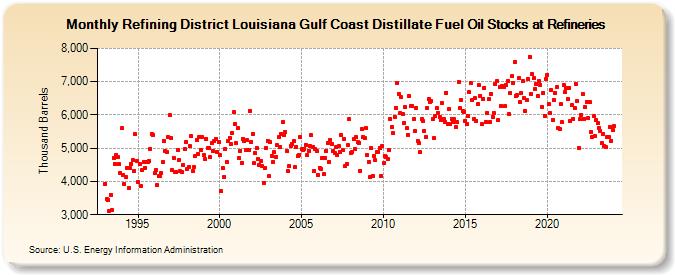
| Refining District Louisiana Gulf Coast Distillate Fuel Oil Stocks at Refineries (Thousand Barrels) | ||||||||
| Year | Jan | Feb | Mar | Apr | May | Jun | Jul | Aug | Sep | Oct | Nov | Dec |
|---|---|---|---|---|---|---|---|---|---|---|---|---|
| 1993 | 3,929 | 3,480 | 3,442 | 3,121 | 3,605 | 3,130 | 4,705 | 4,530 | 4,787 | 4,720 | 4,513 | 4,266 |
| 1994 | 5,592 | 4,197 | 3,933 | 4,136 | 4,415 | 3,796 | 4,399 | 4,532 | 4,639 | 4,315 | 5,414 | 4,618 |
| 1995 | 3,976 | 4,529 | 3,878 | 4,350 | 4,578 | 4,408 | 4,572 | 4,576 | 4,620 | 4,990 | 5,437 | 5,385 |
| 1996 | 4,243 | 4,349 | 3,896 | 4,153 | 4,160 | 4,243 | 4,573 | 5,218 | 4,918 | 4,879 | 5,337 | 5,988 |
| 1997 | 5,317 | 4,335 | 4,716 | 4,285 | 4,284 | 4,953 | 4,649 | 4,310 | 4,273 | 4,508 | 4,964 | 5,185 |
| 1998 | 4,389 | 4,433 | 5,054 | 5,358 | 4,310 | 4,426 | 4,763 | 5,245 | 4,840 | 5,350 | 4,940 | 5,326 |
| 1999 | 4,788 | 4,676 | 5,291 | 5,003 | 5,004 | 4,725 | 5,151 | 4,928 | 5,203 | 5,280 | 4,887 | 5,184 |
| 2000 | 4,781 | 3,701 | 4,395 | 4,125 | 4,989 | 4,587 | 5,207 | 5,312 | 5,131 | 5,457 | 6,080 | 5,742 |
| 2001 | 5,149 | 5,599 | 4,700 | 4,926 | 4,569 | 5,285 | 5,224 | 4,950 | 5,232 | 4,952 | 6,118 | 5,180 |
| 2002 | 5,437 | 4,545 | 4,864 | 5,009 | 4,660 | 4,509 | 4,618 | 4,461 | 3,968 | 4,413 | 5,008 | 5,228 |
| 2003 | 4,151 | 5,171 | 4,769 | 4,592 | 4,877 | 4,744 | 5,085 | 5,336 | 5,048 | 5,423 | 5,776 | 5,389 |
| 2004 | 5,498 | 4,901 | 4,305 | 4,477 | 5,059 | 5,130 | 5,207 | 4,429 | 5,042 | 4,761 | 4,796 | 5,338 |
| 2005 | 4,962 | 4,960 | 4,980 | 5,105 | 4,785 | 4,926 | 5,066 | 5,388 | 5,048 | 4,323 | 4,969 | 4,905 |
| 2006 | 4,197 | 4,405 | 4,383 | 4,696 | 4,214 | 4,715 | 4,922 | 5,157 | 4,590 | 5,249 | 5,116 | 4,916 |
| 2007 | 4,856 | 5,025 | 4,792 | 5,057 | 4,887 | 5,391 | 4,938 | 5,281 | 4,470 | 4,526 | 5,086 | 5,865 |
| 2008 | 4,863 | 4,898 | 5,266 | 4,962 | 5,326 | 5,173 | 5,169 | 4,326 | 5,575 | 5,330 | 5,293 | 5,603 |
| 2009 | 4,784 | 4,589 | 4,121 | 5,013 | 4,174 | 4,763 | 4,631 | 4,885 | 4,878 | 5,013 | 4,174 | 5,070 |
| 2010 | 4,546 | 4,766 | 4,741 | 4,684 | 4,935 | 5,883 | 5,634 | 5,448 | 5,946 | 6,223 | 6,963 | 6,639 |
| 2011 | 6,056 | 6,528 | 6,013 | 5,760 | 6,225 | 5,593 | 5,406 | 6,565 | 6,282 | 6,259 | 5,880 | 5,524 |
| 2012 | 6,203 | 5,211 | 5,142 | 4,876 | 5,876 | 5,810 | 5,524 | 5,338 | 6,213 | 6,480 | 6,396 | 6,408 |
| 2013 | 5,875 | 5,304 | 5,960 | 6,206 | 6,069 | 5,951 | 5,838 | 6,356 | 5,881 | 5,799 | 6,670 | 5,740 |
| 2014 | 6,164 | 5,721 | 5,880 | 5,790 | 5,863 | 5,628 | 5,775 | 6,992 | 6,196 | 6,445 | 6,124 | 6,102 |
| 2015 | 5,820 | 5,721 | 5,955 | 6,676 | 6,946 | 6,462 | 5,872 | 6,499 | 5,827 | 6,316 | 6,898 | 6,575 |
| 2016 | 5,713 | 6,487 | 6,821 | 5,799 | 6,058 | 6,470 | 5,792 | 6,622 | 5,942 | 6,057 | 6,921 | 7,018 |
| 2017 | 5,844 | 6,848 | 6,263 | 6,862 | 6,841 | 6,254 | 6,903 | 7,009 | 6,023 | 6,659 | 7,158 | 6,973 |
| 2018 | 7,585 | 6,578 | 6,588 | 7,102 | 6,386 | 6,644 | 7,018 | 6,496 | 6,113 | 6,434 | 7,065 | 7,749 |
| 2019 | 6,642 | 7,226 | 7,096 | 6,776 | 6,919 | 6,572 | 7,026 | 6,902 | 6,248 | 6,664 | 5,976 | 7,079 |
| 2020 | 7,215 | 6,318 | 6,052 | 6,740 | 5,855 | 6,444 | 6,657 | 6,834 | 5,598 | 5,569 | 6,322 | 5,779 |
| 2021 | 6,896 | 6,688 | 6,797 | 6,475 | 6,820 | 5,814 | 6,294 | 5,872 | 6,203 | 6,928 | 6,410 | 4,999 |
| 2022 | 5,867 | 5,999 | 6,629 | 5,886 | 6,225 | 6,396 | 5,911 | 6,378 | 5,489 | 5,349 | 5,966 | 5,354 |
| 2023 | 5,850 | 5,747 | 5,614 | 5,510 | 5,144 | 5,439 | 5,073 | 5,026 | 5,339 | 5,339 | 5,647 | 5,217 |
| 2024 | 5,552 | |||||||||||
| - = No Data Reported; -- = Not Applicable; NA = Not Available; W = Withheld to avoid disclosure of individual company data. |
| Release Date: 3/29/2024 |
| Next Release Date: 4/30/2024 |