|
Download Data (XLS File) |
|
||||||||
|
||||||||
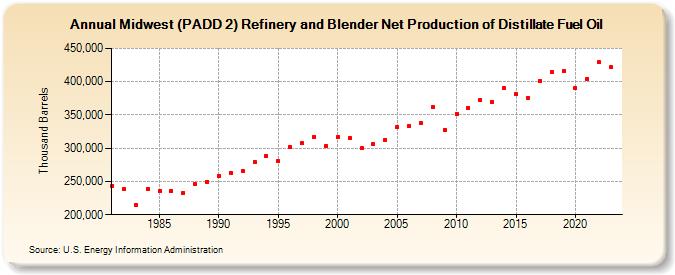
| Midwest (PADD 2) Refinery and Blender Net Production of Distillate Fuel Oil (Thousand Barrels) | ||||||||
| Decade | Year-0 | Year-1 | Year-2 | Year-3 | Year-4 | Year-5 | Year-6 | Year-7 | Year-8 | Year-9 |
|---|---|---|---|---|---|---|---|---|---|---|
| 1980's | 243,624 | 238,936 | 215,024 | 239,054 | 235,156 | 235,771 | 233,011 | 245,696 | 249,571 | |
| 1990's | 258,822 | 262,849 | 266,158 | 279,543 | 288,699 | 280,817 | 301,971 | 307,243 | 317,499 | 303,384 |
| 2000's | 316,974 | 316,023 | 300,255 | 305,923 | 312,648 | 331,568 | 333,483 | 338,378 | 361,420 | 327,849 |
| 2010's | 351,513 | 361,111 | 372,524 | 369,788 | 390,641 | 381,089 | 376,083 | 401,528 | 414,411 | 416,311 |
| 2020's | 390,604 | 404,495 | 428,878 | 421,901 |
| - = No Data Reported; -- = Not Applicable; NA = Not Available; W = Withheld to avoid disclosure of individual company data. |
| Release Date: 3/29/2024 |
| Next Release Date: 8/30/2024 |