|
Download Data (XLS File) |
|
||||||||
|
||||||||
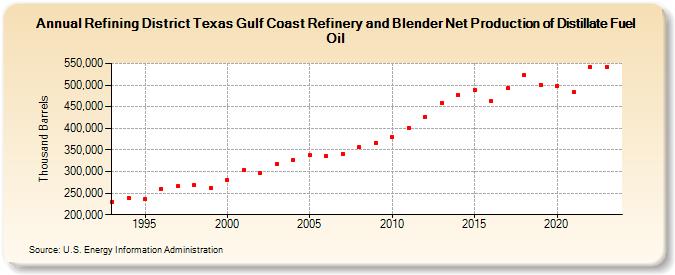
| Refining District Texas Gulf Coast Refinery and Blender Net Production of Distillate Fuel Oil (Thousand Barrels) | ||||||||
| Decade | Year-0 | Year-1 | Year-2 | Year-3 | Year-4 | Year-5 | Year-6 | Year-7 | Year-8 | Year-9 |
|---|---|---|---|---|---|---|---|---|---|---|
| 1990's | 230,168 | 239,381 | 235,929 | 260,242 | 265,778 | 268,135 | 262,348 | |||
| 2000's | 280,749 | 303,239 | 296,750 | 318,169 | 327,541 | 337,171 | 335,664 | 341,282 | 355,917 | 367,046 |
| 2010's | 379,791 | 401,339 | 426,232 | 459,660 | 477,832 | 489,468 | 462,275 | 492,386 | 523,256 | 501,347 |
| 2020's | 499,029 | 484,443 | 542,082 | 538,395 |
| - = No Data Reported; -- = Not Applicable; NA = Not Available; W = Withheld to avoid disclosure of individual company data. |
| Release Date: 8/30/2024 |
| Next Release Date: 8/29/2025 |