|
Download Data (XLS File) |
|
||||||||
|
||||||||
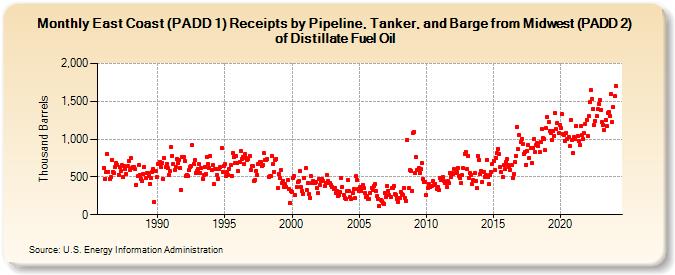
| East Coast (PADD 1) Receipts by Pipeline, Tanker, and Barge from Midwest (PADD 2) of Distillate Fuel Oil (Thousand Barrels) | ||||||||
| Year | Jan | Feb | Mar | Apr | May | Jun | Jul | Aug | Sep | Oct | Nov | Dec |
|---|---|---|---|---|---|---|---|---|---|---|---|---|
| 1986 | 621 | 475 | 562 | 809 | 571 | 474 | 496 | 724 | 571 | 557 | 636 | 689 |
| 1987 | 661 | 529 | 627 | 578 | 653 | 495 | 640 | 604 | 542 | 639 | 714 | 588 |
| 1988 | 748 | 623 | 633 | 633 | 603 | 397 | 507 | 653 | 528 | 470 | 444 | 533 |
| 1989 | 632 | 492 | 546 | 547 | 516 | 412 | 488 | 566 | 607 | 170 | 584 | 495 |
| 1990 | 672 | 676 | 701 | 629 | 688 | 474 | 754 | 633 | 677 | 616 | 520 | 577 |
| 1991 | 902 | 781 | 671 | 588 | 627 | 743 | 681 | 728 | 618 | 325 | 765 | 758 |
| 1992 | 711 | 513 | 523 | 510 | 585 | 626 | 649 | 918 | 672 | 718 | 557 | 584 |
| 1993 | 600 | 667 | 558 | 620 | 472 | 527 | 630 | 537 | 760 | 674 | 621 | 775 |
| 1994 | 593 | 658 | 404 | 605 | 609 | 521 | 478 | 608 | 628 | 879 | 570 | 650 |
| 1995 | 667 | 511 | 567 | 527 | 611 | 654 | 511 | 813 | 761 | 688 | 771 | 681 |
| 1996 | 576 | 694 | 837 | 740 | 766 | 676 | 799 | 752 | 718 | 741 | 781 | 590 |
| 1997 | 646 | 641 | 452 | 460 | 584 | 527 | 673 | 695 | 694 | 639 | 663 | 810 |
| 1998 | 723 | 719 | 742 | 504 | 506 | 506 | 772 | 671 | 569 | 730 | 742 | 347 |
| 1999 | 544 | 480 | 591 | 416 | 447 | 372 | 404 | 373 | 462 | 342 | 161 | 311 |
| 2000 | 306 | 481 | 508 | 258 | 367 | 427 | 445 | 578 | 363 | 314 | 280 | 489 |
| 2001 | 612 | 330 | 414 | 273 | 225 | 508 | 422 | 450 | 424 | 433 | 355 | 282 |
| 2002 | 467 | 399 | 444 | 469 | 452 | 376 | 413 | 530 | 450 | 422 | 415 | 393 |
| 2003 | 372 | 344 | 356 | 285 | 313 | 245 | 257 | 296 | 487 | 371 | 267 | 222 |
| 2004 | 212 | 308 | 459 | 312 | 236 | 208 | 289 | 336 | 218 | 506 | 461 | 337 |
| 2005 | 315 | 371 | 318 | 390 | 353 | 283 | 231 | 247 | 209 | 212 | 285 | 359 |
| 2006 | 331 | 382 | 402 | 313 | 253 | 211 | 116 | 201 | 187 | 160 | 143 | 291 |
| 2007 | 237 | 386 | 319 | 260 | 228 | 354 | 358 | 380 | 270 | 262 | 207 | 171 |
| 2008 | 227 | 304 | 271 | 264 | 351 | 218 | 183 | 989 | 347 | 587 | 584 | 319 |
| 2009 | 1,081 | 1,097 | 556 | 762 | 594 | 618 | 549 | 602 | 682 | 474 | 430 | 427 |
| 2010 | 262 | 350 | 411 | 363 | 380 | 385 | 442 | 398 | 412 | 342 | 365 | 331 |
| 2011 | 480 | 465 | 468 | 500 | 442 | 420 | 369 | 442 | 414 | 556 | 500 | 551 |
| 2012 | 544 | 606 | 554 | 570 | 618 | 514 | 481 | 414 | 521 | 612 | 807 | 834 |
| 2013 | 607 | 783 | 488 | 549 | 530 | 405 | 461 | 551 | 448 | 352 | 777 | 730 |
| 2014 | 535 | 583 | 433 | 567 | 505 | 523 | 729 | 500 | 400 | 531 | 568 | 677 |
| 2015 | 711 | 591 | 755 | 814 | 872 | 806 | 631 | 566 | 493 | 653 | 602 | 702 |
| 2016 | 733 | 663 | 632 | 596 | 653 | 489 | 541 | 699 | 774 | 1,159 | 863 | 1,051 |
| 2017 | 962 | 1,001 | 935 | 804 | 834 | 661 | 844 | 925 | 754 | 886 | 685 | 888 |
| 2018 | 1,003 | 825 | 917 | 951 | 906 | 824 | 964 | 1,136 | 1,011 | 998 | 850 | 1,144 |
| 2019 | 1,292 | 1,225 | 1,101 | 1,079 | 990 | 1,102 | 1,038 | 1,341 | 1,130 | 1,215 | 1,079 | 1,184 |
| 2020 | 1,148 | 1,328 | 1,074 | 1,059 | 980 | 1,083 | 1,006 | 1,028 | 909 | 1,250 | 985 | 812 |
| 2021 | 1,031 | 997 | 1,175 | 1,042 | 977 | 920 | 1,176 | 1,048 | 998 | 1,075 | 1,203 | 1,259 |
| 2022 | 1,043 | 1,299 | 1,486 | 1,644 | 1,527 | 1,401 | 1,182 | 1,237 | 1,305 | 1,392 | 1,466 | 1,518 |
| 2023 | 1,386 | 1,224 | 1,189 | 1,114 | 1,257 | 1,174 | 1,342 | 1,358 | 1,306 | 1,601 | 1,226 | 1,427 |
| 2024 | 1,564 | |||||||||||
| - = No Data Reported; -- = Not Applicable; NA = Not Available; W = Withheld to avoid disclosure of individual company data. |
| Release Date: 3/29/2024 |
| Next Release Date: 4/30/2024 |