|
Download Data (XLS File) |
|
||||||||
|
||||||||
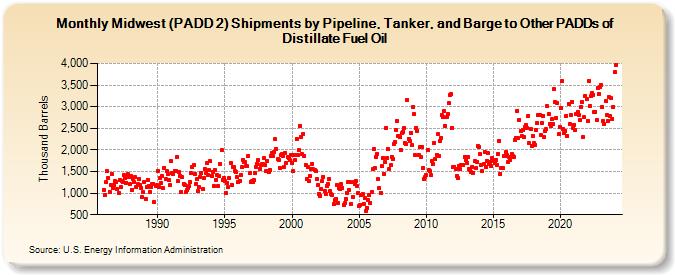
| Midwest (PADD 2) Shipments by Pipeline, Tanker, and Barge to Other PADDs of Distillate Fuel Oil (Thousand Barrels) | ||||||||
| Year | Jan | Feb | Mar | Apr | May | Jun | Jul | Aug | Sep | Oct | Nov | Dec |
|---|---|---|---|---|---|---|---|---|---|---|---|---|
| 1986 | 1,078 | 960 | 1,258 | 1,504 | 1,360 | 1,035 | 1,193 | 1,448 | 1,124 | 1,177 | 1,276 | 1,253 |
| 1987 | 1,089 | 1,007 | 1,311 | 1,138 | 1,282 | 1,257 | 1,410 | 1,350 | 1,241 | 1,432 | 1,375 | 1,209 |
| 1988 | 1,386 | 1,080 | 1,322 | 1,251 | 1,364 | 1,144 | 1,204 | 1,337 | 1,186 | 1,126 | 910 | 1,018 |
| 1989 | 1,262 | 873 | 1,143 | 1,300 | 1,173 | 1,034 | 1,148 | 1,208 | 1,218 | 787 | 1,155 | 1,188 |
| 1990 | 1,517 | 1,150 | 1,343 | 1,245 | 1,407 | 1,108 | 1,592 | 1,319 | 1,503 | 1,433 | 1,296 | 1,180 |
| 1991 | 1,734 | 1,463 | 1,445 | 1,515 | 1,505 | 1,841 | 1,282 | 1,492 | 1,393 | 1,018 | 1,367 | 1,213 |
| 1992 | 1,188 | 1,019 | 1,075 | 1,117 | 1,159 | 1,250 | 1,458 | 1,602 | 1,640 | 1,452 | 1,207 | 1,315 |
| 1993 | 1,045 | 1,131 | 1,373 | 1,471 | 1,088 | 1,354 | 1,565 | 1,454 | 1,697 | 1,421 | 1,524 | 1,736 |
| 1994 | 1,397 | 1,499 | 1,161 | 1,534 | 1,314 | 1,426 | 1,176 | 1,391 | 1,685 | 1,987 | 1,305 | 1,356 |
| 1995 | 1,273 | 995 | 1,229 | 1,131 | 1,354 | 1,705 | 1,194 | 1,611 | 1,597 | 1,517 | 1,486 | 1,368 |
| 1996 | 1,249 | 1,287 | 1,416 | 1,597 | 1,773 | 1,710 | 1,709 | 1,620 | 1,619 | 1,856 | 1,459 | 1,260 |
| 1997 | 1,273 | 1,263 | 1,299 | 1,476 | 1,615 | 1,675 | 1,761 | 1,561 | 1,652 | 1,663 | 1,671 | 1,806 |
| 1998 | 1,646 | 1,521 | 1,743 | 1,479 | 1,541 | 1,865 | 1,937 | 1,859 | 1,961 | 2,242 | 2,026 | 1,778 |
| 1999 | 1,772 | 1,589 | 1,873 | 1,902 | 1,852 | 1,613 | 1,935 | 1,706 | 1,834 | 1,818 | 1,758 | 1,893 |
| 2000 | 1,698 | 1,502 | 1,883 | 1,769 | 2,262 | 1,891 | 1,995 | 2,557 | 2,310 | 1,894 | 2,368 | 1,862 |
| 2001 | 1,652 | 1,322 | 1,594 | 1,281 | 1,401 | 1,558 | 1,683 | 1,552 | 1,535 | 1,523 | 1,316 | 1,184 |
| 2002 | 990 | 944 | 1,098 | 1,283 | 1,375 | 1,053 | 981 | 1,165 | 1,208 | 1,336 | 1,044 | 978 |
| 2003 | 963 | 745 | 834 | 858 | 1,196 | 770 | 1,111 | 1,103 | 1,210 | 1,123 | 721 | 761 |
| 2004 | 869 | 1,007 | 1,252 | 1,073 | 1,251 | 756 | 917 | 1,253 | 1,206 | 1,276 | 1,165 | 1,013 |
| 2005 | 692 | 736 | 958 | 988 | 749 | 894 | 597 | 664 | 840 | 954 | 776 | 1,025 |
| 2006 | 1,552 | 2,020 | 1,573 | 1,845 | 1,913 | 1,315 | 1,107 | 1,013 | 1,618 | 1,817 | 1,453 | 1,721 |
| 2007 | 2,515 | 1,811 | 2,016 | 1,562 | 1,643 | 1,842 | 1,785 | 2,142 | 2,186 | 2,467 | 2,668 | 2,328 |
| 2008 | 2,307 | 2,006 | 2,384 | 2,422 | 2,502 | 2,164 | 2,139 | 3,159 | 2,259 | 2,213 | 2,402 | 2,107 |
| 2009 | 3,001 | 2,829 | 1,878 | 2,507 | 2,447 | 1,883 | 2,061 | 1,835 | 2,077 | 1,577 | 1,317 | 1,372 |
| 2010 | 1,410 | 1,994 | 1,525 | 1,507 | 1,411 | 1,745 | 1,678 | 2,167 | 1,784 | 1,891 | 2,362 | 1,868 |
| 2011 | 2,208 | 2,281 | 2,805 | 2,755 | 2,906 | 2,552 | 2,769 | 2,827 | 3,084 | 3,272 | 3,287 | 2,514 |
| 2012 | 1,594 | 1,614 | 1,560 | 1,392 | 1,339 | 1,628 | 1,551 | 1,647 | 1,647 | 1,645 | 1,842 | 1,759 |
| 2013 | 1,703 | 1,840 | 1,554 | 1,530 | 1,487 | 1,607 | 1,469 | 1,741 | 1,571 | 1,718 | 2,097 | 2,066 |
| 2014 | 1,904 | 1,661 | 1,522 | 1,667 | 1,961 | 1,597 | 1,750 | 1,922 | 1,682 | 1,728 | 1,624 | 1,821 |
| 2015 | 1,742 | 1,687 | 1,775 | 1,656 | 1,914 | 2,217 | 1,453 | 1,585 | 1,574 | 1,856 | 1,856 | 1,955 |
| 2016 | 1,878 | 1,712 | 1,836 | 1,777 | 1,901 | 1,863 | 1,843 | 2,227 | 2,285 | 2,905 | 2,272 | 2,703 |
| 2017 | 2,431 | 2,316 | 2,467 | 2,290 | 2,538 | 2,566 | 2,505 | 2,786 | 2,157 | 2,481 | 2,086 | 2,331 |
| 2018 | 2,158 | 2,114 | 2,466 | 2,614 | 2,807 | 2,809 | 2,344 | 2,615 | 2,785 | 2,288 | 2,428 | 2,475 |
| 2019 | 3,009 | 2,828 | 2,589 | 2,560 | 2,709 | 2,610 | 3,401 | 3,098 | 2,740 | 3,074 | 2,359 | 2,538 |
| 2020 | 2,963 | 3,593 | 2,480 | 2,400 | 2,440 | 2,791 | 2,319 | 3,072 | 2,604 | 2,809 | 3,116 | 2,505 |
| 2021 | 2,583 | 2,463 | 2,822 | 2,878 | 2,810 | 2,685 | 3,004 | 3,103 | 2,300 | 2,750 | 3,253 | 3,173 |
| 2022 | 2,675 | 3,600 | 3,021 | 3,243 | 3,315 | 3,280 | 2,866 | 2,887 | 2,691 | 3,438 | 3,300 | 3,459 |
| 2023 | 3,504 | 3,001 | 2,666 | 2,602 | 3,136 | 2,807 | 2,673 | 3,222 | 2,775 | 3,193 | 2,723 | 3,004 |
| 2024 | 3,795 | |||||||||||
| - = No Data Reported; -- = Not Applicable; NA = Not Available; W = Withheld to avoid disclosure of individual company data. |
| Release Date: 3/29/2024 |
| Next Release Date: 4/30/2024 |