|
Download Data (XLS File) |
|
||||||||
|
||||||||
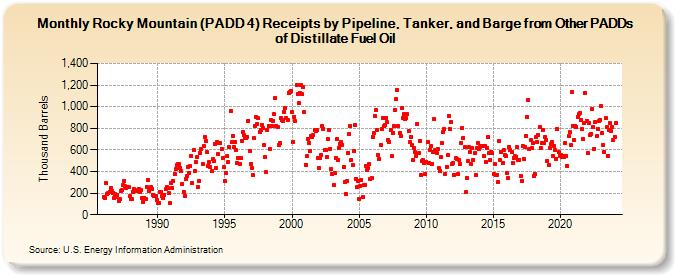
| Rocky Mountain (PADD 4) Receipts by Pipeline, Tanker, and Barge from Other PADDs of Distillate Fuel Oil (Thousand Barrels) | ||||||||
| Year | Jan | Feb | Mar | Apr | May | Jun | Jul | Aug | Sep | Oct | Nov | Dec |
|---|---|---|---|---|---|---|---|---|---|---|---|---|
| 1986 | 164 | 154 | 290 | 196 | 198 | 212 | 251 | 216 | 205 | 154 | 193 | 161 |
| 1987 | 178 | 128 | 142 | 219 | 225 | 273 | 313 | 262 | 245 | 256 | 257 | 169 |
| 1988 | 146 | 143 | 213 | 234 | 217 | 220 | 225 | 238 | 212 | 225 | 152 | 118 |
| 1989 | 159 | 150 | 259 | 325 | 223 | 239 | 252 | 235 | 186 | 177 | 172 | 136 |
| 1990 | 112 | 108 | 214 | 210 | 172 | 158 | 185 | 235 | 257 | 244 | 198 | 107 |
| 1991 | 297 | 251 | 312 | 376 | 420 | 456 | 467 | 467 | 431 | 407 | 286 | 214 |
| 1992 | 174 | 330 | 356 | 445 | 390 | 447 | 546 | 298 | 597 | 408 | 488 | 530 |
| 1993 | 257 | 309 | 573 | 608 | 469 | 637 | 721 | 681 | 576 | 454 | 484 | 446 |
| 1994 | 401 | 513 | 496 | 653 | 435 | 673 | 558 | 662 | 665 | 609 | 527 | 441 |
| 1995 | 309 | 388 | 540 | 490 | 625 | 960 | 670 | 731 | 626 | 674 | 598 | 479 |
| 1996 | 522 | 468 | 522 | 685 | 769 | 734 | 714 | 706 | 722 | 870 | 588 | 470 |
| 1997 | 432 | 368 | 711 | 819 | 902 | 842 | 891 | 766 | 788 | 833 | 804 | 646 |
| 1998 | 530 | 392 | 787 | 822 | 610 | 873 | 824 | 870 | 929 | 1,081 | 822 | 809 |
| 1999 | 643 | 662 | 891 | 874 | 866 | 952 | 990 | 893 | 873 | 1,130 | 1,136 | 1,143 |
| 2000 | 948 | 677 | 909 | 864 | 1,205 | 1,116 | 1,030 | 1,123 | 1,199 | 1,114 | 1,185 | 950 |
| 2001 | 463 | 539 | 701 | 664 | 592 | 728 | 716 | 734 | 783 | 775 | 784 | 526 |
| 2002 | 435 | 522 | 549 | 821 | 797 | 598 | 597 | 537 | 698 | 781 | 612 | 421 |
| 2003 | 377 | 275 | 382 | 528 | 698 | 511 | 622 | 654 | 674 | 648 | 444 | 302 |
| 2004 | 194 | 308 | 575 | 743 | 823 | 506 | 462 | 591 | 826 | 333 | 254 | 309 |
| 2005 | 149 | 270 | 322 | 161 | 275 | 279 | 454 | 413 | 430 | 469 | 330 | 341 |
| 2006 | 724 | 752 | 912 | 967 | 786 | 555 | 517 | 643 | 795 | 897 | 823 | 826 |
| 2007 | 897 | 855 | 688 | 677 | 788 | 540 | 761 | 821 | 970 | 1,071 | 1,155 | 824 |
| 2008 | 758 | 732 | 986 | 894 | 933 | 886 | 895 | 928 | 772 | 671 | 722 | 642 |
| 2009 | 502 | 616 | 579 | 544 | 841 | 567 | 685 | 368 | 493 | 505 | 483 | 373 |
| 2010 | 489 | 673 | 479 | 601 | 634 | 467 | 576 | 888 | 597 | 575 | 612 | 434 |
| 2011 | 403 | 533 | 662 | 765 | 792 | 378 | 442 | 550 | 916 | 797 | 858 | 473 |
| 2012 | 480 | 372 | 521 | 515 | 379 | 503 | 472 | 662 | 806 | 711 | 624 | 209 |
| 2013 | 343 | 494 | 625 | 578 | 465 | 616 | 510 | 571 | 369 | 617 | 664 | 612 |
| 2014 | 630 | 632 | 635 | 541 | 632 | 492 | 619 | 720 | 569 | 507 | 585 | 568 |
| 2015 | 373 | 468 | 371 | 369 | 303 | 683 | 504 | 579 | 475 | 602 | 554 | 541 |
| 2016 | 384 | 343 | 630 | 596 | 581 | 483 | 529 | 543 | 538 | 624 | 506 | 510 |
| 2017 | 361 | 310 | 640 | 520 | 629 | 730 | 904 | 1,063 | 611 | 688 | 617 | 663 |
| 2018 | 355 | 375 | 721 | 673 | 737 | 810 | 619 | 662 | 787 | 665 | 723 | 694 |
| 2019 | 498 | 457 | 614 | 650 | 671 | 546 | 638 | 595 | 518 | 789 | 578 | 547 |
| 2020 | 552 | 534 | 542 | 536 | 661 | 544 | 449 | 727 | 765 | 645 | 1,138 | 822 |
| 2021 | 692 | 819 | 813 | 906 | 930 | 942 | 881 | 791 | 702 | 847 | 1,131 | 870 |
| 2022 | 572 | 852 | 735 | 750 | 983 | 812 | 611 | 860 | 728 | 796 | 867 | 881 |
| 2023 | 1,006 | 759 | 641 | 585 | 894 | 809 | 548 | 780 | 847 | 772 | 813 | 691 |
| 2024 | 724 | |||||||||||
| - = No Data Reported; -- = Not Applicable; NA = Not Available; W = Withheld to avoid disclosure of individual company data. |
| Release Date: 3/29/2024 |
| Next Release Date: 4/30/2024 |
Referring Pages: