|
Download Data (XLS File) |
|
||||||||
|
||||||||
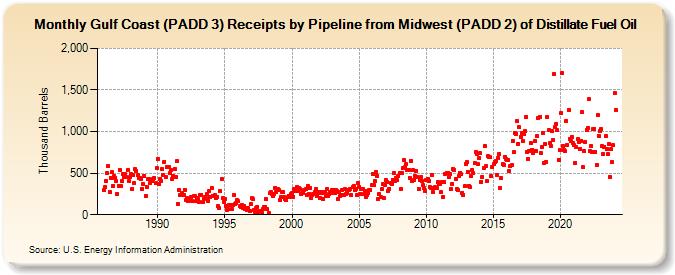
| Gulf Coast (PADD 3) Receipts by Pipeline from Midwest (PADD 2) of Distillate Fuel Oil (Thousand Barrels) | ||||||||
| Year | Jan | Feb | Mar | Apr | May | Jun | Jul | Aug | Sep | Oct | Nov | Dec |
|---|---|---|---|---|---|---|---|---|---|---|---|---|
| 1986 | 293 | 331 | 406 | 499 | 591 | 279 | 446 | 508 | 348 | 466 | 447 | 403 |
| 1987 | 250 | 350 | 542 | 341 | 404 | 489 | 457 | 484 | 454 | 537 | 404 | 452 |
| 1988 | 492 | 314 | 476 | 384 | 544 | 527 | 472 | 446 | 446 | 431 | 314 | 367 |
| 1989 | 471 | 231 | 338 | 428 | 434 | 383 | 408 | 407 | 425 | 440 | 377 | 557 |
| 1990 | 675 | 366 | 428 | 406 | 547 | 476 | 637 | 451 | 569 | 573 | 578 | 496 |
| 1991 | 535 | 431 | 462 | 551 | 458 | 642 | 134 | 297 | 237 | 234 | 261 | 241 |
| 1992 | 303 | 176 | 196 | 162 | 184 | 177 | 212 | 161 | 220 | 222 | 162 | 201 |
| 1993 | 188 | 155 | 242 | 243 | 147 | 190 | 214 | 195 | 244 | 168 | 285 | 217 |
| 1994 | 322 | 231 | 224 | 236 | 201 | 217 | 99 | 80 | 281 | 432 | 200 | 154 |
| 1995 | 194 | 102 | 59 | 64 | 120 | 120 | 68 | 122 | 240 | 128 | 142 | 174 |
| 1996 | 160 | 101 | 96 | 122 | 83 | 109 | 71 | 75 | 51 | 75 | 43 | 129 |
| 1997 | 195 | 186 | 59 | 29 | 84 | 97 | 31 | 45 | 35 | 23 | 64 | 90 |
| 1998 | 94 | 183 | 66 | 26 | 261 | 274 | 251 | 230 | 250 | 323 | 268 | 304 |
| 1999 | 297 | 178 | 208 | 278 | 270 | 210 | 185 | 173 | 209 | 229 | 207 | 245 |
| 2000 | 261 | 216 | 313 | 282 | 328 | 291 | 322 | 312 | 248 | 265 | 265 | 302 |
| 2001 | 307 | 243 | 343 | 253 | 326 | 205 | 240 | 249 | 272 | 306 | 231 | 270 |
| 2002 | 260 | 206 | 277 | 265 | 187 | 276 | 228 | 312 | 230 | 245 | 268 | 266 |
| 2003 | 294 | 302 | 263 | 297 | 290 | 183 | 271 | 224 | 234 | 296 | 235 | 304 |
| 2004 | 245 | 267 | 302 | 295 | 307 | 239 | 333 | 344 | 293 | 310 | 232 | 380 |
| 2005 | 338 | 254 | 307 | 304 | 246 | 285 | 217 | 235 | 261 | 301 | 298 | 354 |
| 2006 | 492 | 357 | 400 | 516 | 466 | 191 | 247 | 217 | 306 | 364 | 206 | 363 |
| 2007 | 419 | 390 | 283 | 312 | 381 | 365 | 423 | 506 | 408 | 443 | 416 | 468 |
| 2008 | 502 | 304 | 506 | 558 | 653 | 569 | 606 | 540 | 535 | 445 | 650 | 404 |
| 2009 | 537 | 418 | 466 | 526 | 451 | 308 | 420 | 451 | 405 | 354 | 321 | 286 |
| 2010 | 420 | 431 | 402 | 332 | 317 | 480 | 273 | 318 | 336 | 316 | 390 | 371 |
| 2011 | 364 | 269 | 391 | 215 | 395 | 488 | 507 | 505 | 453 | 490 | 307 | 373 |
| 2012 | 547 | 540 | 433 | 307 | 299 | 467 | 506 | 486 | 266 | 240 | 341 | 610 |
| 2013 | 628 | 518 | 348 | 329 | 467 | 539 | 498 | 619 | 754 | 725 | 606 | 680 |
| 2014 | 739 | 399 | 454 | 559 | 824 | 582 | 402 | 702 | 692 | 690 | 471 | 576 |
| 2015 | 608 | 628 | 649 | 473 | 679 | 728 | 318 | 440 | 606 | 601 | 700 | 673 |
| 2016 | 655 | 658 | 524 | 585 | 592 | 891 | 749 | 985 | 973 | 1,122 | 854 | 1,050 |
| 2017 | 936 | 985 | 892 | 966 | 1,001 | 1,175 | 757 | 674 | 768 | 861 | 784 | 740 |
| 2018 | 762 | 889 | 767 | 942 | 1,164 | 1,175 | 745 | 817 | 987 | 625 | 855 | 637 |
| 2019 | 1,172 | 1,017 | 859 | 831 | 1,007 | 899 | 1,693 | 1,049 | 1,092 | 1,014 | 663 | 775 |
| 2020 | 1,223 | 1,699 | 824 | 783 | 761 | 1,132 | 841 | 1,262 | 914 | 889 | 938 | 860 |
| 2021 | 836 | 623 | 810 | 907 | 880 | 792 | 892 | 1,233 | 569 | 767 | 872 | 1,020 |
| 2022 | 1,044 | 1,388 | 768 | 825 | 758 | 1,028 | 1,031 | 758 | 601 | 1,199 | 951 | 1,008 |
| 2023 | 1,030 | 821 | 733 | 818 | 946 | 789 | 732 | 846 | 456 | 785 | 634 | 833 |
| 2024 | 1,460 | |||||||||||
| - = No Data Reported; -- = Not Applicable; NA = Not Available; W = Withheld to avoid disclosure of individual company data. |
| Release Date: 3/29/2024 |
| Next Release Date: 4/30/2024 |