|
Download Data (XLS File) |
|
||||||||
|
||||||||
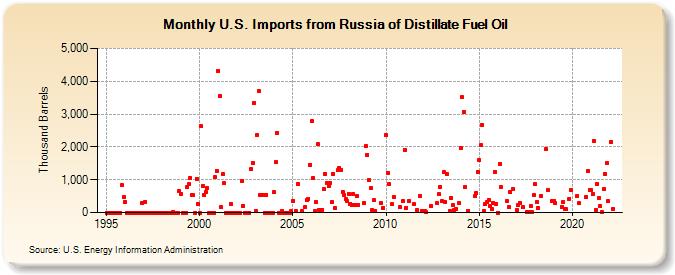
| U.S. Imports from Russia of Distillate Fuel Oil (Thousand Barrels) | ||||||||
| Year | Jan | Feb | Mar | Apr | May | Jun | Jul | Aug | Sep | Oct | Nov | Dec |
|---|---|---|---|---|---|---|---|---|---|---|---|---|
| 1995 | 0 | 0 | 0 | 0 | 0 | 0 | 0 | 0 | 0 | 0 | 831 | 469 |
| 1996 | 326 | 0 | 0 | 0 | 0 | 0 | 0 | 0 | 0 | 0 | 0 | 298 |
| 1997 | 0 | 330 | 0 | 0 | 0 | 0 | 0 | 0 | 0 | 0 | 0 | 0 |
| 1998 | 0 | 0 | 0 | 0 | 0 | 0 | 0 | 29 | 0 | 0 | 0 | 650 |
| 1999 | 580 | 0 | 0 | 0 | 773 | 858 | 1,054 | 533 | 526 | 0 | 1,032 | 256 |
| 2000 | 0 | 2,622 | 813 | 528 | 634 | 737 | 0 | 0 | 0 | 0 | 1,068 | 1,277 |
| 2001 | 4,325 | 3,546 | 156 | 1,169 | 890 | 0 | 0 | 0 | 259 | 0 | 0 | 0 |
| 2002 | 0 | 0 | 0 | 973 | 201 | 0 | 0 | 0 | 0 | 1,314 | 1,515 | 3,349 |
| 2003 | 55 | 2,368 | 3,711 | 545 | 527 | 526 | 0 | 550 | 0 | 0 | 0 | 0 |
| 2004 | 611 | 1,531 | 2,432 | 0 | 0 | 37 | 0 | 0 | 0 | 0 | 0 | 38 |
| 2005 | 361 | 36 | 877 | 45 | 166 | 390 | 426 | 1,460 | ||||
| 2006 | 2,778 | 1,045 | 36 | 316 | 2,077 | 75 | 75 | 91 | 705 | 1,181 | 901 | 796 |
| 2007 | 896 | 318 | 1,174 | 154 | 1,281 | 1,366 | 1,304 | 633 | 549 | 416 | 345 | |
| 2008 | 580 | 271 | 230 | 564 | 216 | 499 | 237 | 298 | 2,022 | |||
| 2009 | 1,758 | 989 | 747 | 80 | 369 | 48 | 280 | 152 | ||||
| 2010 | 2,354 | 1,212 | 860 | 255 | 470 | 164 | 349 | |||||
| 2011 | 1,908 | 150 | 352 | 247 | 70 | 495 | 50 | |||||
| 2012 | 33 | 2 | 204 | 283 | 551 | 780 | ||||||
| 2013 | 344 | 1,222 | 335 | 1,179 | 55 | 442 | 224 | 70 | 110 | 292 | ||
| 2014 | 1,966 | 3,509 | 3,064 | 779 | 59 | 500 | 590 | 1,233 | ||||
| 2015 | 1,597 | 2,050 | 2,667 | 40 | 247 | 328 | 389 | 215 | 100 | 301 | 1,243 | 262 |
| 2016 | 0 | 1,481 | 791 | 344 | 172 | 632 | 705 | |||||
| 2017 | 76 | 220 | 299 | 165 | 24 | 20 | 207 | 7 | 534 | |||
| 2018 | 855 | 319 | 151 | 506 | 1,921 | 679 | 345 | |||||
| 2019 | 364 | 278 | 174 | 310 | 110 | 95 | 425 | 680 | ||||
| 2020 | 499 | 285 | 478 | 1,267 | 678 | |||||||
| 2021 | 679 | 577 | 2,181 | 88 | 867 | 454 | 194 | 23 | 720 | 1,184 | 1,505 | 337 |
| 2022 | 2,157 | 110 | ||||||||||
| - = No Data Reported; -- = Not Applicable; NA = Not Available; W = Withheld to avoid disclosure of individual company data. |
| Release Date: 3/29/2024 |
| Next Release Date: 4/30/2024 |