|
Download Data (XLS File) |
|
||||||||
|
||||||||
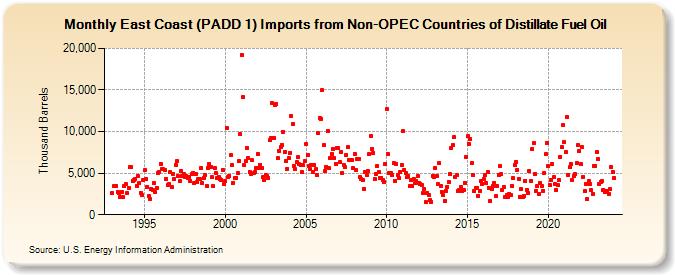
| East Coast (PADD 1) Imports from Non-OPEC Countries of Distillate Fuel Oil (Thousand Barrels) | ||||||||
| Year | Jan | Feb | Mar | Apr | May | Jun | Jul | Aug | Sep | Oct | Nov | Dec |
|---|---|---|---|---|---|---|---|---|---|---|---|---|
| 1993 | 2,559 | 3,414 | 3,460 | 3,488 | 2,759 | 2,596 | 2,187 | 2,762 | 2,100 | 3,414 | 3,714 | 2,602 |
| 1994 | 3,231 | 5,706 | 5,720 | 4,065 | 4,150 | 4,298 | 3,512 | 4,657 | 3,816 | 2,647 | 2,427 | 4,231 |
| 1995 | 5,334 | 4,319 | 3,341 | 2,265 | 1,919 | 3,080 | 3,009 | 3,796 | 2,715 | 3,266 | 4,958 | 5,159 |
| 1996 | 6,145 | 5,485 | 5,453 | 5,410 | 4,325 | 3,587 | 3,641 | 5,124 | 3,307 | 4,914 | 4,336 | 6,020 |
| 1997 | 6,399 | 4,636 | 4,047 | 5,236 | 4,709 | 4,882 | 4,516 | 4,651 | 4,421 | 4,552 | 4,081 | 4,862 |
| 1998 | 5,048 | 3,847 | 4,897 | 3,947 | 4,263 | 4,276 | 5,582 | 3,774 | 4,441 | 4,772 | 3,507 | 5,672 |
| 1999 | 6,085 | 5,784 | 4,496 | 3,427 | 5,644 | 5,061 | 4,415 | 4,552 | 4,258 | 4,192 | 5,435 | 3,749 |
| 2000 | 4,012 | 10,451 | 4,580 | 4,711 | 7,128 | 6,023 | 3,870 | 4,423 | 4,468 | 4,966 | 6,451 | 9,663 |
| 2001 | 19,246 | 14,119 | 5,974 | 6,411 | 8,027 | 6,829 | 5,167 | 4,930 | 6,535 | 5,041 | 5,132 | 5,648 |
| 2002 | 7,332 | 5,655 | 5,990 | 5,602 | 4,581 | 4,132 | 4,748 | 4,661 | 4,468 | 8,938 | 9,271 | 13,425 |
| 2003 | 9,268 | 13,220 | 13,366 | 6,761 | 7,713 | 8,085 | 8,417 | 9,994 | 7,516 | 6,434 | 5,548 | 6,836 |
| 2004 | 7,453 | 11,830 | 10,898 | 5,902 | 5,446 | 6,328 | 6,920 | 6,042 | 5,925 | 5,092 | 5,940 | 6,422 |
| 2005 | 8,497 | 7,155 | 5,845 | 5,443 | 5,920 | 5,135 | 5,981 | 5,440 | 4,828 | 9,786 | 11,601 | 11,533 |
| 2006 | 14,951 | 8,329 | 5,241 | 5,770 | 10,045 | 5,611 | 6,866 | 7,315 | 7,895 | 6,798 | 6,069 | 8,042 |
| 2007 | 7,992 | 6,313 | 7,500 | 5,015 | 6,033 | 5,685 | 7,161 | 8,124 | 6,604 | 6,561 | 6,602 | 5,586 |
| 2008 | 7,338 | 5,376 | 6,709 | 6,720 | 4,554 | 4,330 | 4,125 | 3,144 | 5,172 | 4,815 | 5,212 | 7,248 |
| 2009 | 9,497 | 7,942 | 7,464 | 4,279 | 4,858 | 5,880 | 5,134 | 4,411 | 4,465 | 4,196 | 3,904 | 6,158 |
| 2010 | 12,679 | 7,266 | 5,034 | 5,021 | 4,790 | 6,199 | 4,088 | 6,146 | 4,824 | 4,421 | 5,141 | 5,967 |
| 2011 | 10,055 | 5,413 | 5,020 | 4,500 | 4,672 | 3,421 | 4,178 | 3,425 | 4,354 | 3,773 | 4,008 | 4,672 |
| 2012 | 3,838 | 3,722 | 3,548 | 2,625 | 3,061 | 1,519 | 2,614 | 2,364 | 1,737 | 1,581 | 4,663 | 4,564 |
| 2013 | 5,638 | 4,611 | 3,645 | 6,171 | 3,503 | 2,748 | 2,326 | 1,704 | 2,871 | 3,367 | 3,958 | 4,867 |
| 2014 | 8,009 | 8,328 | 9,307 | 4,584 | 4,742 | 2,901 | 2,965 | 3,348 | 2,824 | 3,029 | 3,820 | 6,979 |
| 2015 | 9,417 | 8,555 | 9,096 | 6,238 | 4,812 | 2,864 | 3,231 | 3,235 | 2,278 | 2,862 | 3,995 | 3,717 |
| 2016 | 4,244 | 4,764 | 3,767 | 5,103 | 3,249 | 1,623 | 3,080 | 3,400 | 3,825 | 2,209 | 3,400 | 4,816 |
| 2017 | 5,803 | 4,854 | 3,003 | 3,350 | 2,162 | 2,363 | 2,179 | 2,537 | 2,423 | 3,462 | 4,403 | 6,024 |
| 2018 | 6,371 | 5,414 | 4,353 | 2,178 | 3,041 | 2,115 | 2,299 | 4,085 | 2,980 | 2,596 | 5,227 | 4,099 |
| 2019 | 7,872 | 8,625 | 4,933 | 2,874 | 3,472 | 2,499 | 3,822 | 3,487 | 2,864 | 5,027 | 7,249 | 8,682 |
| 2020 | 5,857 | 3,583 | 4,155 | 6,081 | 4,479 | 3,740 | 2,957 | 3,545 | 4,127 | 6,972 | 8,092 | 10,749 |
| 2021 | 8,701 | 7,486 | 11,716 | 4,795 | 5,695 | 6,078 | 4,159 | 4,621 | 4,854 | 6,207 | 8,337 | 7,646 |
| 2022 | 6,040 | 8,096 | 4,576 | 2,834 | 3,637 | 1,898 | 4,021 | 3,680 | 2,925 | 2,533 | 5,898 | 5,917 |
| 2023 | 7,514 | 6,688 | 3,650 | 3,943 | 4,003 | 3,029 | 2,715 | 2,827 | 2,825 | 2,500 | 3,040 | 5,694 |
| 2024 | 5,132 | |||||||||||
| - = No Data Reported; -- = Not Applicable; NA = Not Available; W = Withheld to avoid disclosure of individual company data. |
| Release Date: 3/29/2024 |
| Next Release Date: 4/30/2024 |