|
Download Data (XLS File) |
|
||||||||
|
||||||||
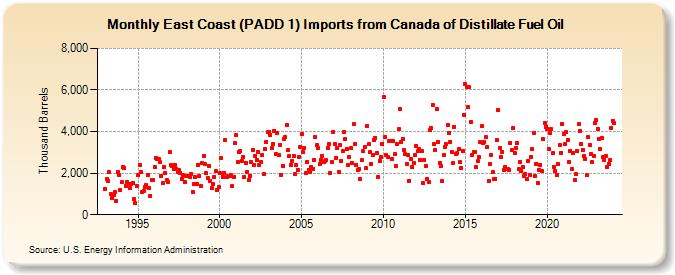
| East Coast (PADD 1) Imports from Canada of Distillate Fuel Oil (Thousand Barrels) | ||||||||
| Year | Jan | Feb | Mar | Apr | May | Jun | Jul | Aug | Sep | Oct | Nov | Dec |
|---|---|---|---|---|---|---|---|---|---|---|---|---|
| 1993 | 1,237 | 1,709 | 1,603 | 2,034 | 996 | 782 | 967 | 1,078 | 683 | 2,062 | 1,905 | 1,182 |
| 1994 | 1,559 | 2,306 | 2,238 | 1,389 | 1,572 | 1,500 | 1,263 | 1,492 | 1,534 | 750 | 541 | 1,397 |
| 1995 | 1,891 | 2,403 | 2,047 | 1,114 | 1,132 | 1,313 | 1,434 | 1,911 | 1,302 | 903 | 1,660 | 1,653 |
| 1996 | 2,306 | 2,735 | 2,690 | 2,659 | 2,512 | 1,864 | 1,521 | 2,314 | 1,998 | 1,690 | 1,569 | 3,009 |
| 1997 | 2,402 | 2,326 | 2,188 | 2,403 | 2,218 | 2,046 | 2,137 | 2,022 | 1,733 | 1,898 | 1,580 | 1,878 |
| 1998 | 1,860 | 1,866 | 1,828 | 1,973 | 1,108 | 1,474 | 1,804 | 1,499 | 2,410 | 1,871 | 1,396 | 2,482 |
| 1999 | 2,831 | 2,445 | 2,005 | 1,742 | 2,364 | 1,626 | 1,286 | 1,464 | 1,826 | 2,082 | 1,192 | 1,315 |
| 2000 | 1,997 | 2,726 | 1,831 | 2,010 | 3,612 | 1,795 | 1,841 | 1,845 | 1,888 | 1,378 | 1,831 | 3,434 |
| 2001 | 3,844 | 2,542 | 3,019 | 3,079 | 2,606 | 2,779 | 1,816 | 2,502 | 2,076 | 1,681 | 1,876 | 2,530 |
| 2002 | 3,129 | 2,406 | 2,816 | 2,625 | 3,038 | 2,388 | 2,533 | 2,862 | 1,943 | 3,145 | 3,505 | 3,965 |
| 2003 | 3,996 | 3,853 | 3,188 | 3,419 | 4,047 | 2,936 | 3,924 | 2,883 | 3,344 | 1,917 | 2,367 | 3,658 |
| 2004 | 3,724 | 4,304 | 3,098 | 2,828 | 2,405 | 2,569 | 2,848 | 1,950 | 2,391 | 2,172 | 2,786 | 3,270 |
| 2005 | 3,885 | 3,006 | 3,210 | 1,990 | 2,537 | 2,169 | 2,045 | 2,305 | 2,216 | 2,640 | 3,737 | 3,332 |
| 2006 | 3,222 | 2,434 | 2,650 | 2,816 | 2,529 | 2,580 | 2,613 | 3,225 | 3,414 | 2,016 | 2,557 | 3,975 |
| 2007 | 3,403 | 2,750 | 3,189 | 2,078 | 3,347 | 2,575 | 3,046 | 3,971 | 3,655 | 3,184 | 2,398 | 2,776 |
| 2008 | 3,206 | 2,471 | 4,350 | 3,415 | 2,408 | 2,156 | 2,198 | 1,698 | 2,615 | 3,048 | 3,262 | 2,233 |
| 2009 | 4,274 | 3,384 | 2,994 | 2,462 | 2,883 | 3,573 | 3,706 | 2,977 | 1,834 | 2,579 | 2,752 | 3,413 |
| 2010 | 5,643 | 3,748 | 2,864 | 2,783 | 3,530 | 3,538 | 2,668 | 3,540 | 2,904 | 2,366 | 3,395 | 4,107 |
| 2011 | 5,064 | 3,500 | 3,633 | 3,119 | 2,907 | 2,463 | 2,886 | 1,637 | 2,701 | 2,304 | 2,501 | 2,863 |
| 2012 | 3,311 | 3,045 | 3,178 | 2,625 | 3,061 | 1,519 | 2,614 | 2,364 | 1,737 | 1,581 | 4,079 | 4,178 |
| 2013 | 5,294 | 3,389 | 3,112 | 5,084 | 3,503 | 2,475 | 2,326 | 1,602 | 2,871 | 3,279 | 3,388 | 4,320 |
| 2014 | 3,946 | 3,518 | 3,033 | 2,499 | 4,240 | 2,901 | 2,965 | 3,153 | 2,516 | 2,255 | 3,072 | 4,812 |
| 2015 | 6,295 | 6,139 | 5,181 | 6,121 | 4,470 | 2,864 | 3,006 | 3,020 | 2,278 | 2,561 | 2,752 | 3,483 |
| 2016 | 4,244 | 3,436 | 3,504 | 3,726 | 3,249 | 1,623 | 2,450 | 2,895 | 2,051 | 1,721 | 1,719 | 3,582 |
| 2017 | 5,038 | 3,185 | 2,795 | 3,030 | 2,162 | 2,288 | 2,179 | 2,188 | 2,174 | 3,462 | 3,095 | 4,152 |
| 2018 | 2,973 | 3,227 | 3,430 | 2,178 | 2,535 | 2,115 | 2,299 | 1,868 | 1,948 | 1,701 | 2,591 | 1,906 |
| 2019 | 2,793 | 3,163 | 3,935 | 1,842 | 2,459 | 1,540 | 2,166 | 2,405 | 2,112 | 3,628 | 4,388 | 4,234 |
| 2020 | 4,141 | 3,142 | 3,935 | 4,118 | 2,960 | 2,318 | 2,083 | 1,900 | 2,432 | 3,365 | 2,986 | 4,368 |
| 2021 | 3,880 | 3,405 | 3,977 | 3,583 | 2,546 | 3,058 | 2,199 | 2,973 | 1,648 | 1,942 | 3,051 | 4,346 |
| 2022 | 4,023 | 3,409 | 3,124 | 2,834 | 2,682 | 1,898 | 3,736 | 3,370 | 2,925 | 2,533 | 2,847 | 4,420 |
| 2023 | 4,541 | 4,137 | 3,650 | 3,161 | 3,697 | 2,760 | 2,647 | 2,827 | 2,313 | 2,435 | 2,611 | 4,190 |
| 2024 | 4,529 | |||||||||||
| - = No Data Reported; -- = Not Applicable; NA = Not Available; W = Withheld to avoid disclosure of individual company data. |
| Release Date: 3/29/2024 |
| Next Release Date: 4/30/2024 |