|
Download Data (XLS File) |
|
||||||||
|
||||||||
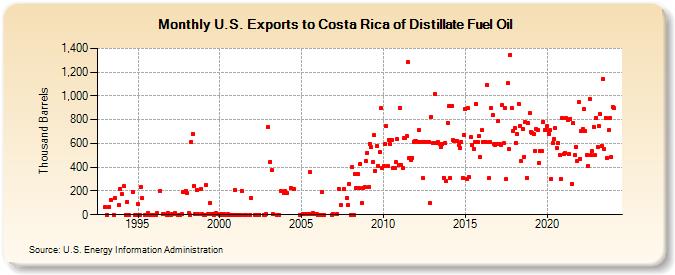
| U.S. Exports to Costa Rica of Distillate Fuel Oil (Thousand Barrels) | ||||||||
| Year | Jan | Feb | Mar | Apr | May | Jun | Jul | Aug | Sep | Oct | Nov | Dec |
|---|---|---|---|---|---|---|---|---|---|---|---|---|
| 1993 | 63 | 0 | 69 | 125 | 0 | 139 | 80 | 217 | ||||
| 1994 | 171 | 238 | 0 | 110 | 0 | 195 | 0 | 0 | ||||
| 1995 | 87 | 0 | 233 | 140 | 0 | 13 | 0 | 1 | 1 | |||
| 1996 | 0 | 11 | 201 | 2 | 3 | 0 | 12 | 0 | ||||
| 1997 | 1 | 2 | 4 | 14 | 0 | 0 | 0 | 2 | 191 | 200 | ||
| 1998 | 181 | 12 | 1 | 616 | 682 | 244 | 2 | 207 | 2 | 216 | 4 | |
| 1999 | 1 | 1 | 251 | 4 | 2 | 101 | 4 | 2 | 1 | 13 | 2 | |
| 2000 | 0 | 2 | 1 | 2 | 1 | 0 | 3 | 0 | 1 | 0 | 1 | 207 |
| 2001 | 0 | 0 | 0 | 0 | 200 | 0 | 0 | 0 | 139 | |||
| 2002 | 1 | 1 | 1 | 1 | 1 | 2 | 737 | |||||
| 2003 | 446 | 374 | 2 | 1 | 1 | 198 | 185 | |||||
| 2004 | 199 | 180 | 224 | 216 | 0 | |||||||
| 2005 | 2 | 5 | 6 | 4 | 4 | 357 | 3 | 16 | 4 | 5 | 2 | |
| 2006 | 0 | 0 | 0 | 195 | 0 | 1 | 2 | |||||
| 2007 | 2 | 220 | 78 | 220 | 139 | 79 | 262 | |||||
| 2008 | 1 | 402 | 1 | 341 | 221 | 341 | 221 | 431 | 100 | 227 | 230 | 452 |
| 2009 | 522 | 231 | 599 | 566 | 440 | 668 | 371 | 580 | 406 | 524 | 896 | 396 |
| 2010 | 411 | 595 | 745 | 412 | 629 | 594 | 629 | 394 | 395 | 442 | 635 | 415 |
| 2011 | 900 | 420 | 391 | 644 | 647 | 660 | 1,283 | 481 | 460 | 480 | 615 | 618 |
| 2012 | 618 | 615 | 709 | 616 | 615 | 308 | 610 | 616 | 608 | 616 | 100 | 824 |
| 2013 | 605 | 601 | 1,015 | 607 | 611 | 595 | 568 | 596 | 312 | 606 | 282 | 773 |
| 2014 | 911 | 309 | 918 | 628 | 617 | 623 | 622 | 584 | 564 | 613 | 311 | 670 |
| 2015 | 887 | 302 | 896 | 314 | 651 | 590 | 554 | 608 | 932 | 610 | 660 | 484 |
| 2016 | 713 | 609 | 610 | 608 | 1,091 | 306 | 614 | 902 | 839 | 595 | 588 | 596 |
| 2017 | 785 | 596 | 589 | 921 | 601 | 900 | 298 | 1,105 | 549 | 1,348 | 895 | 701 |
| 2018 | 731 | 602 | 681 | 936 | 748 | 449 | 720 | 490 | 778 | 312 | 770 | 852 |
| 2019 | 696 | 689 | 680 | 540 | 719 | 711 | 439 | 534 | 533 | 783 | 711 | 710 |
| 2020 | 746 | 681 | 711 | 302 | 600 | 637 | 729 | 563 | 602 | 502 | 302 | 813 |
| 2021 | 508 | 521 | 816 | 800 | 511 | 809 | 261 | 770 | 500 | 566 | 449 | 946 |
| 2022 | 472 | 704 | 721 | 886 | 702 | 505 | 410 | 974 | 500 | 534 | 740 | 499 |
| 2023 | 817 | 567 | 744 | 845 | 582 | 1,142 | 550 | 816 | 478 | 709 | 814 | 484 |
| 2024 | 910 | |||||||||||
| - = No Data Reported; -- = Not Applicable; NA = Not Available; W = Withheld to avoid disclosure of individual company data. |
| Release Date: 3/29/2024 |
| Next Release Date: 4/30/2024 |