|
Download Data (XLS File) |
|
||||||||
|
||||||||
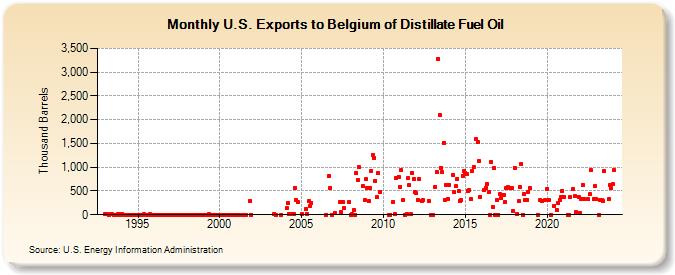
| U.S. Exports to Belgium of Distillate Fuel Oil (Thousand Barrels) | ||||||||
| Year | Jan | Feb | Mar | Apr | May | Jun | Jul | Aug | Sep | Oct | Nov | Dec |
|---|---|---|---|---|---|---|---|---|---|---|---|---|
| 1993 | 18 | 6 | 0 | 8 | 8 | 3 | 0 | 8 | 13 | 0 | ||
| 1994 | 25 | 0 | 0 | 1 | 0 | 0 | 4 | 0 | 1 | 2 | 1 | |
| 1995 | 1 | 1 | 1 | 3 | 12 | 1 | 1 | 1 | 10 | 1 | 1 | |
| 1996 | 0 | 0 | 1 | 1 | 2 | 0 | 2 | 0 | 1 | 1 | ||
| 1997 | 0 | 1 | 1 | 0 | 1 | 1 | 0 | 2 | 1 | 1 | 1 | 1 |
| 1998 | 2 | 0 | 1 | 1 | 0 | 1 | 2 | 1 | 2 | 0 | 1 | 0 |
| 1999 | 1 | 1 | 2 | 1 | 6 | 1 | 0 | 0 | 0 | 1 | 0 | 1 |
| 2000 | 1 | 1 | 0 | 1 | 0 | 2 | 0 | 0 | 0 | 1 | 1 | |
| 2001 | 0 | 0 | 0 | 0 | 0 | 0 | 289 | 0 | ||||
| 2003 | 24 | 0 | 0 | |||||||||
| 2004 | 138 | 245 | 19 | 17 | 10 | 569 | 305 | 258 | ||||
| 2005 | 16 | 130 | 11 | 280 | 190 | 250 | ||||||
| 2006 | 1 | 825 | 559 | 1 | ||||||||
| 2007 | 42 | 259 | 56 | 260 | 135 | 270 | ||||||
| 2008 | 1 | 6 | 99 | 1 | 887 | 732 | 995 | 598 | 306 | 749 | ||
| 2009 | 571 | 280 | 567 | 928 | 1,265 | 1,202 | 714 | 366 | 878 | 476 | ||
| 2010 | 0 | 1 | 273 | 6 | 767 | 799 | ||||||
| 2011 | 592 | 933 | 300 | 4 | 7 | 765 | 620 | 7 | 887 | 755 | 475 | |
| 2012 | 448 | 318 | 754 | 293 | 300 | 299 | 3 | |||||
| 2013 | 1 | 589 | 897 | 3,283 | 2,096 | 989 | 890 | 1,512 | 315 | 631 | 334 | |
| 2014 | 630 | 841 | 470 | 597 | 755 | 500 | 299 | 301 | 822 | 917 | ||
| 2015 | 877 | 860 | 504 | 511 | 323 | 930 | 1,005 | 1,584 | 1,529 | 1,134 | 378 | |
| 2016 | 524 | 572 | 650 | 468 | 0 | 1,112 | 168 | 984 | 0 | 307 | ||
| 2017 | 0 | 429 | 349 | 413 | 419 | 272 | 561 | 575 | 569 | 557 | 87 | |
| 2018 | 986 | 15 | 283 | 575 | 1,071 | 0 | 428 | 310 | 311 | 483 | 558 | |
| 2019 | 0 | 301 | 287 | 303 | ||||||||
| 2020 | 546 | 300 | 0 | 192 | 107 | 241 | 305 | 373 | 501 | |||
| 2021 | 374 | 1 | 0 | 374 | 539 | 387 | 48 | 383 | ||||
| 2022 | 44 | 338 | 628 | 334 | 324 | 426 | 933 | 324 | 595 | |||
| 2023 | 325 | 0 | 302 | 305 | 297 | 922 | 330 | 625 | 553 | |||
| 2024 | 646 | |||||||||||
| - = No Data Reported; -- = Not Applicable; NA = Not Available; W = Withheld to avoid disclosure of individual company data. |
| Release Date: 3/29/2024 |
| Next Release Date: 4/30/2024 |