|
Download Data (XLS File) |
|
||||||||
|
||||||||
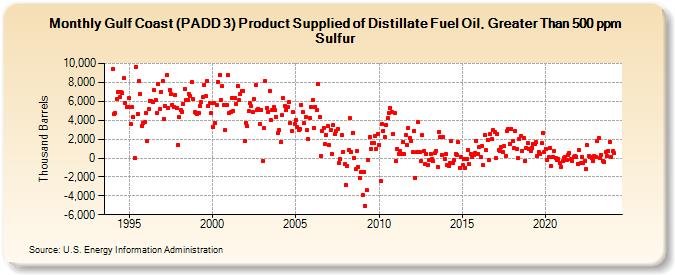
| Gulf Coast (PADD 3) Product Supplied of Distillate Fuel Oil, Greater Than 500 ppm Sulfur (Thousand Barrels) | ||||||||
| Year | Jan | Feb | Mar | Apr | May | Jun | Jul | Aug | Sep | Oct | Nov | Dec |
|---|---|---|---|---|---|---|---|---|---|---|---|---|
| 1994 | 9,370 | 4,628 | 4,755 | 6,222 | 7,005 | 6,437 | 6,945 | 6,906 | 8,424 | 5,799 | 5,448 | 5,409 |
| 1995 | 6,301 | 3,606 | 5,368 | 4,330 | 5 | 9,629 | 4,693 | 8,143 | 6,817 | 3,391 | 3,651 | 3,765 |
| 1996 | 4,770 | 1,808 | 5,166 | 6,034 | 5,995 | 5,938 | 7,174 | 6,134 | 4,746 | 7,880 | 5,136 | 6,983 |
| 1997 | 8,165 | 4,109 | 5,526 | 8,778 | 5,243 | 7,188 | 6,811 | 5,653 | 5,425 | 6,679 | 5,254 | 1,418 |
| 1998 | 4,310 | 5,079 | 4,917 | 5,755 | 7,286 | 6,189 | 6,092 | 6,745 | 6,577 | 7,989 | 6,208 | 4,826 |
| 1999 | 4,798 | 4,688 | 4,764 | 5,519 | 5,921 | 6,411 | 7,771 | 6,577 | 8,153 | 5,531 | 5,810 | 4,715 |
| 2000 | 3,296 | 5,795 | 3,738 | 5,583 | 8,068 | 8,804 | 6,124 | 7,612 | 5,609 | 2,917 | 5,560 | 8,763 |
| 2001 | 4,736 | 4,906 | 6,396 | 4,985 | 6,368 | 5,738 | 7,626 | 6,092 | 6,775 | 7,139 | 7,104 | 1,796 |
| 2002 | 3,728 | 3,345 | 4,934 | 5,777 | 5,475 | 4,818 | 6,191 | 7,752 | 5,072 | 5,207 | 3,628 | 5,111 |
| 2003 | -320 | 3,184 | 8,134 | 5,282 | 4,876 | 7,098 | 4,002 | 5,094 | 5,364 | 5,055 | 4,356 | 2,646 |
| 2004 | 2,920 | 1,691 | 4,509 | 6,297 | 5,508 | 5,120 | 5,389 | 5,891 | 3,749 | 2,836 | 4,895 | 3,640 |
| 2005 | 4,013 | 3,258 | 2,956 | 3,058 | 5,626 | 4,845 | 3,657 | 4,320 | 2,914 | 1,965 | 4,238 | 5,387 |
| 2006 | 6,111 | 3,194 | 5,430 | 5,093 | 7,868 | 4,319 | 191 | 2,838 | 3,215 | 1,481 | 2,438 | 3,365 |
| 2007 | 1,348 | 2,964 | 404 | 3,472 | 2,493 | 2,822 | 3,069 | -551 | -136 | 2,381 | 684 | -638 |
| 2008 | -2,805 | -805 | 846 | 4,198 | 607 | 2,685 | 33 | -1,191 | 771 | -953 | -2,101 | -1,530 |
| 2009 | -3,935 | -1,492 | -5,033 | -3,435 | -244 | 2,208 | 937 | 1,600 | 1,635 | 2,285 | 970 | 2,515 |
| 2010 | 1,413 | -2,480 | 3,558 | 2,884 | 2,268 | 3,515 | 4,229 | 4,713 | 5,314 | 4,882 | 2,573 | 4,778 |
| 2011 | -308 | 991 | 412 | 732 | 439 | 1,745 | 379 | 2,440 | 1,418 | 3,188 | 2,126 | 1,818 |
| 2012 | 634 | 2,900 | -2,084 | 626 | 3,790 | 584 | -335 | 2,395 | 741 | -642 | 412 | -722 |
| 2013 | -235 | 448 | -95 | -325 | 555 | 785 | -902 | 2,782 | 2,189 | 357 | 2,273 | -101 |
| 2014 | 416 | -724 | -830 | -549 | 1,799 | -572 | -161 | 425 | 293 | 1,647 | -1,008 | 73 |
| 2015 | -785 | -83 | -1,042 | -129 | 863 | -647 | 429 | 150 | 341 | 562 | 1,803 | 462 |
| 2016 | 1,177 | 103 | 1,276 | -792 | 2,434 | 836 | 1,948 | -255 | 2,507 | 2,025 | 2,931 | 2,706 |
| 2017 | 6 | 2,551 | 883 | 769 | 1,164 | 665 | 1,237 | 223 | 2,889 | 3,086 | 1,494 | 3,105 |
| 2018 | 1,794 | 1,030 | 2,833 | 937 | -50 | 2,057 | 2,287 | 756 | 2,157 | -269 | 1,065 | 1,561 |
| 2019 | 1,004 | 758 | 1,092 | 1,441 | 1,498 | 1,665 | 233 | 611 | 398 | 1,557 | 2,621 | 629 |
| 2020 | 987 | -257 | 96 | 1,083 | -795 | 96 | 744 | -46 | -255 | -80 | -545 | -918 |
| 2021 | -358 | 48 | 77 | -255 | 310 | 574 | -141 | -356 | 88 | 226 | 148 | -607 |
| 2022 | 858 | -537 | 137 | -518 | -333 | -1,165 | 1,342 | 170 | 145 | 30 | -274 | 220 |
| 2023 | 116 | 1,849 | 2,077 | 24 | 333 | -308 | -375 | 616 | 182 | 742 | 1,702 | 121 |
| 2024 | 693 | |||||||||||
| - = No Data Reported; -- = Not Applicable; NA = Not Available; W = Withheld to avoid disclosure of individual company data. |
| Release Date: 3/29/2024 |
| Next Release Date: 4/30/2024 |